Statistics · Penetration testing
Penetration Testing Statistics 2026: ~$2.8B Market, 100 Stats
About $2.8 billion is the middle estimate of the global penetration testing market in 2026, based on eight research firms' published figures reviewed by The PenTest Index. The middle estimate for 2025 was about $2.4 billion. The firms disagree a lot: their 2025 figures run from $1.98 billion to $3.36 billion. That is the first of 100 penetration testing statistics below.
Each one shows where it comes from and the period it covers. (A penetration test, or pentest, is a planned, permitted attack on your own systems to find weak spots.) You'll also find who really tests, what 21 rules require, how long fixes take, what providers charge, and 12 popular numbers that need a source check.
Key penetration testing statistics (2026)
- Market size: The middle estimate of the global penetration testing market is about $2.8 billion for 2026 and $2.4 billion for 2025, from 8 and 19 research firms respectively (The PenTest Index review, October 2026). Source.
- How much firms disagree: Research firms put the 2025 penetration testing market anywhere from $1.98 billion to $3.36 billion. The highest estimate is 1.7 times the lowest (The PenTest Index review, October 2026). Source.
- Who tests: 13% of UK businesses reported a penetration test in the 12 months before the survey, fielded August–December 2025. Among the smallest it was 10%; among large ones, 60% (UK Cyber Security Breaches Survey 2025/2026). Source.
- By country: 34.6% of EU businesses with 10 or more staff ran security tests of any kind in 2024, in the sectors covered, a measure that includes penetration tests. Among EU countries, the share runs from 18.2% in Hungary to 53.4% in the Netherlands (Eurostat, 2024). Source.
- Rules: 8 of the 21 entries in our rule tracker are in the group that requires testing; 5 set an annual baseline. CMMC Level 3 is listed separately because its contracting rollout is suspended (The PenTest Index rule tracker, October 2026). Source.
- Rules that don't: SOC 2, ISO/IEC 27001, the HIPAA Security Rule and CMMC Level 2 do not require a penetration test in their own text (The PenTest Index rule tracker, October 2026). Source.
- Time to fix: Four reports published in 2026 give serious-flaw repair and resolution benchmarks of 38 to 58 days. Their measures differ. These figures are about three to four times a two-week target reported by three-quarters of respondents in a 2025 Cobalt survey (The PenTest Index comparison of Cobalt, Synack, Edgescan and Verizon figures). Source.
- Fast and slow: Among Cobalt's customers, the median organization resolves half of its high-risk findings within 45 days. The fastest 1 in 10 take 10 days; the slowest 1 in 10 take 249 days (Cobalt, State of Pentesting Report 2026; more than 16,500 tests over five years). “Resolved” includes accepted risk. Source.
- By industry: In Cobalt's data, the time to resolve half of high-risk findings runs from 38 days in software to 98 days in entertainment. A typical customer resolves 86% of its high-risk findings, counting accepted risks (Cobalt, State of Pentesting Report 2026). Source.
- Prices not on the price page: 28 of the 43 penetration testing providers we checked showed no price for a test on the current pricing or service pages we read on October 8, 2026. For 21 of the 28 we found no price for their own tests on any checked page (The PenTest Index published price check). Source.
- Published prices: Published U.S.-dollar starting prices for one test not sold as AI-run range from US$3,000 to US$12,400 across 10 offers from two providers. The two AI-run single-test references with an explicit U.S.-dollar currency are US$1,500 per asset and US$4,000 per web application. (The PenTest Index published price check, October 8, 2026). Source.
- Hourly rates: The median GSA ceiling rate for a labor category whose title contains "penetration" and "tester" is $157.53 an hour, with rates from $57.34 to $320.56 (The PenTest Index analysis of 417 contract rate records, checked October 8, 2026). Source.
- AI: 32% of findings in tests of AI applications are high risk, against 12% across all tests. Only 38.4% of those high-risk AI findings are recorded as resolved, against 77.3% for APIs (Cobalt, State of Pentesting Report 2026; five years of tests). “Resolved” includes accepted risk. Source.
- Breaches: In 31% of breaches with a known entry route, excluding error and misuse, the attacker exploited a vulnerability, a weak spot in software. That's up from 20% a year earlier (Verizon, 2026 Data Breach Investigations Report). Source.
- Numbers to check: We checked 12 popular penetration testing claims: 5 were misquoted, 4 were outdated as current claims, 2 had no primary source we could find and 1 rests on a weak method (The PenTest Index source check, October 2026). Source.
On this page: Market size · Who tests · How often · Rules · What tests find · Time to fix · Cost · AI · Providers · Breaches · Checked numbers · All statistics · Why now · Method · Limits · Cite · Download · Questions · Sources
How big is the penetration testing market?
The middle estimate of the global penetration testing market was about $2.4 billion for 2025 and $2.8 billion for 2026. Those are the middle figures from research firms' published estimates: 19 firms for 2025 ($1.98 billion to $3.36 billion) and 8 of those firms for 2026 ($2.42 billion to $3.14 billion). The middle growth forecast is 15.3% a year.
These are estimates from research firms' models. The firms sell the reports. Most put a free headline number on their report page, and those numbers don't match. So we lined up every one we could find.
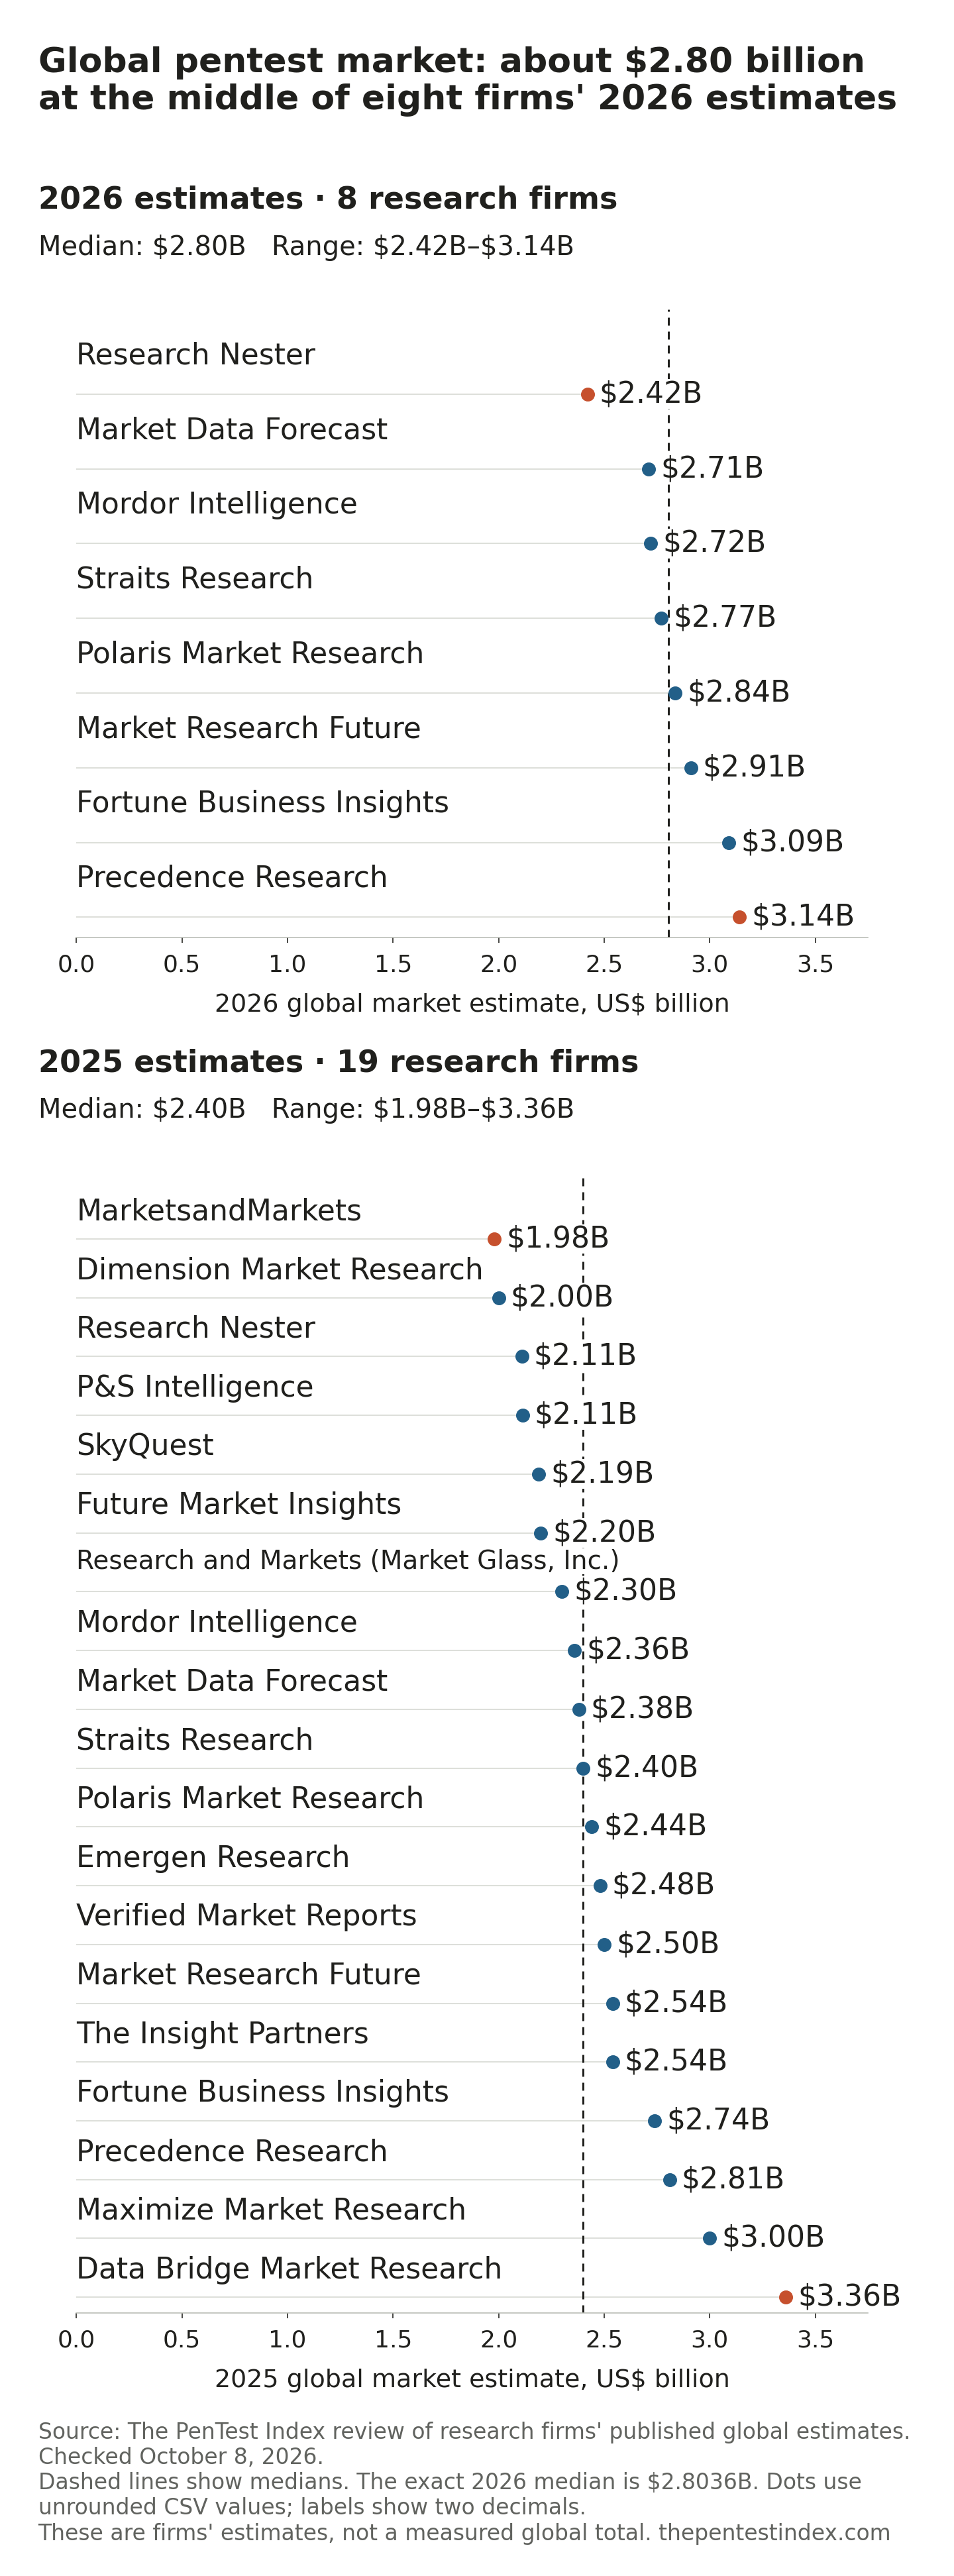
| # | Research firm | 2025 estimate | 2026 estimate | Long-range forecast | Published yearly growth |
|---|---|---|---|---|---|
| 1 | MarketsandMarkets | $1.98B | not given | $4.39B by 2031 | 14.20% |
| 2 | Dimension Market Research | $2.00B | not given | $8.70B by 2034 | 17.70% |
| 3 | Research Nester | $2.11B | $2.42B | $9.63B by 2035 | over 16.40% |
| 4 | P&S Intelligence | $2.11B | not given | $4.71B by 2030 | 17.20% |
| 5 | SkyQuest | $2.19B | not given | $7.74B by 2033 | 17.10% |
| 6 | Future Market Insights | $2.20B | not given | $8.40B by 2035 | 14.40% |
| 7 | Research and Markets (Market Glass, Inc.) | $2.30B | not given | $6.70B by 2032 | 16.50% |
| 8 | Mordor Intelligence | $2.36B | $2.72B | $5.54B by 2031 | 15.29% |
| 9 | Market Data Forecast | $2.38B | $2.71B | $7.56B by 2034 | 13.70% |
| 10 | Straits Research | $2.40B | $2.77B | $8.63B by 2034 | 15.28% |
| 11 | Polaris Market Research | $2.44B | $2.84B | $9.58B by 2034 | 16.40% |
| 12 | Emergen Research | $2.48B | not given | $9.42B by 2035 | 14.60% |
| 13 | Verified Market Reports | $2.50B | not given | $5.90B by 2032 | 13.05% |
| 14 | Market Research Future | $2.54B | $2.91B | $9.62B by 2035 | 14.20% |
| 15 | The Insight Partners | $2.54B | not given | $9.80B by 2034 | 16.21% |
| 16 | Fortune Business Insights | $2.74B | $3.09B | $7.41B by 2034 | 11.60% |
| 17 | Precedence Research | $2.81B | $3.14B | $8.51B by 2035 | 11.72% |
| 18 | Maximize Market Research | $3.00B | not given | $8.74B by 2032 | 16.50% |
| 19 | Data Bridge Market Research | $3.36B | not given | $14.44B by 2033 | 20.00% |
Source: each linked firm's public report page or named publisher excerpt, read October 8, 2026. Growth rates use each firm's own forecast period, which differs across rows. The medians describe these published estimates; they are not measured market revenue. "Not given" means the page shows no figure for that year. Middle (median) of 19 for 2025: $2.40 billion. Middle of the 8 that give a 2026 figure: $2.80 billion.
Here's the problem in one example. Two writers can each quote "the" market size. One says $1.98 billion. The other says $3.36 billion. Both have a source. The highest estimate is 1.7 times the lowest.
The figure many statistics pages repeat, $2.74 billion for 2025 and $3.09 billion for 2026, comes from one firm (Fortune Business Insights). It is the fourth highest of the 19.
Why do the estimates differ?
The firms count different things. Of the 19, ten list software, tools or solutions alongside services. One describes manual and automated assessment services, and one counts professional services plus related platforms. Seven do not give a clear revenue boundary on their public page. And 6 of the 19 pages show conflicting figures for the same thing on the same page.
| Publisher | Conflicting labels or values |
|---|---|
| MarketsandMarkets | U.S. 2031 forecast: $4.38B and $4.39B |
| Fortune Business Insights | North America's 2025 share: 35.10% and 39.70% |
| Future Market Insights | 2025 size: $2.20B, $1.6766B and $1.9136B |
| Emergen Research | 2025 size: $2.48B and $2.84B; yearly growth: 14.6% and 14.8% |
| SkyQuest | 2033 forecast: $7.74B and $7.77B; snapshot also gives a different base value and growth rate |
| Data Bridge Market Research | Yearly growth: 2.00% in the summary and 20.00% in the body |
Source: as stated in each row or in the linked source line.
The table uses each global summary figure, with the conflict retained here and in the data file. It does not pick a different value to make the estimates agree.
Eight more pages were left out of the middle figure. Seven give no 2025 number (Grand View Research, Global Market Insights, Verified Market Research, Zion Market Research, Allied Market Research, Technavio and Cybersecurity Ventures). Cognitive Market Research ($1.86 billion) was left out because its public page warns that displayed charts, numbers and data are representative and do not depict actual statistics. All eight are in the download with their numbers. Add Cognitive back in and the 2025 middle moves only to $2.39 billion.
How fast is the penetration testing market growing?
Forecasts run from 11.6% to 20.0% a year. The middle forecast is 15.3% a year. At that pace the market would double in about five years. Long-range forecasts run from $4.39 billion by 2031 (MarketsandMarkets) to $14.44 billion by 2033 (Data Bridge Market Research).
For a simple illustration: grow the $2.40 billion 2025 middle by 15.29% and you get $2.77 billion for 2026. That lands close to the $2.80 billion middle of the firms that publish a 2026 figure.
How big is the PTaaS market?
PTaaS means penetration testing sold as a subscription service, usually through an online platform. Six firms put the 2026 PTaaS market anywhere from $165 million to $2.81 billion. That's a 17-fold gap: where one firm sees $1, another sees $17.
| Research firm | 2026 estimate | What the page includes (summary) |
|---|---|---|
| 360iResearch (January 2026 report excerpt) | $165 million | Recurring testing, validation, reporting, remediation and retesting; exact revenue boundary not clear |
| MarketsandMarkets | $720 million | Platform and managed services |
| Dimension Market Research | $990 million | Cloud platforms, on-demand human testing and workflow infrastructure |
| Persistence Market Research | $1.20 billion | Expert-led assessments with continuous testing platforms |
| Global Market Insights | $2.60 billion | Managed penetration testing services (56.6% in 2025) plus platform-based PTaaS (43.4%) |
| The Business Research Company | $2.81 billion | Services, plus sales of automated testing tools and platforms |
Source: each firm's public report page, read October 8, 2026. Two more firms (Verified Market Research and Polaris Market Research) give no 2026 figure; both are in the download.
The 360iResearch value is from its January 2026 publisher report excerpt on Research and Markets. Its newer original-site summary omits market sizing. Its stated 18.89% yearly growth differs from the 19.27% implied by its 2026 and 2032 figures; the CSV preserves both facts.
The firms draw the boundary in different ways and use different models. Some include platforms, managed services or tool sales. Their public pages do not show enough detail to explain the full gap. So pick one firm, name it, and say what it counts.
If you're buying a test rather than sizing the market, you can compare penetration testing companies on published price, scope and retest terms.
What percentage of companies do penetration testing?
13% of UK businesses ran a penetration test in the 12 months before the survey, according to the UK government's 2025/2026 Cyber Security Breaches Survey, fielded August–December 2025. Among large businesses the share was 60%. Among the smallest it was 10%. We found no official U.S. figure.
Pick 100 UK businesses at random and about 13 ran a penetration test in the past 12 months. Pick 100 large ones and it's about 60.
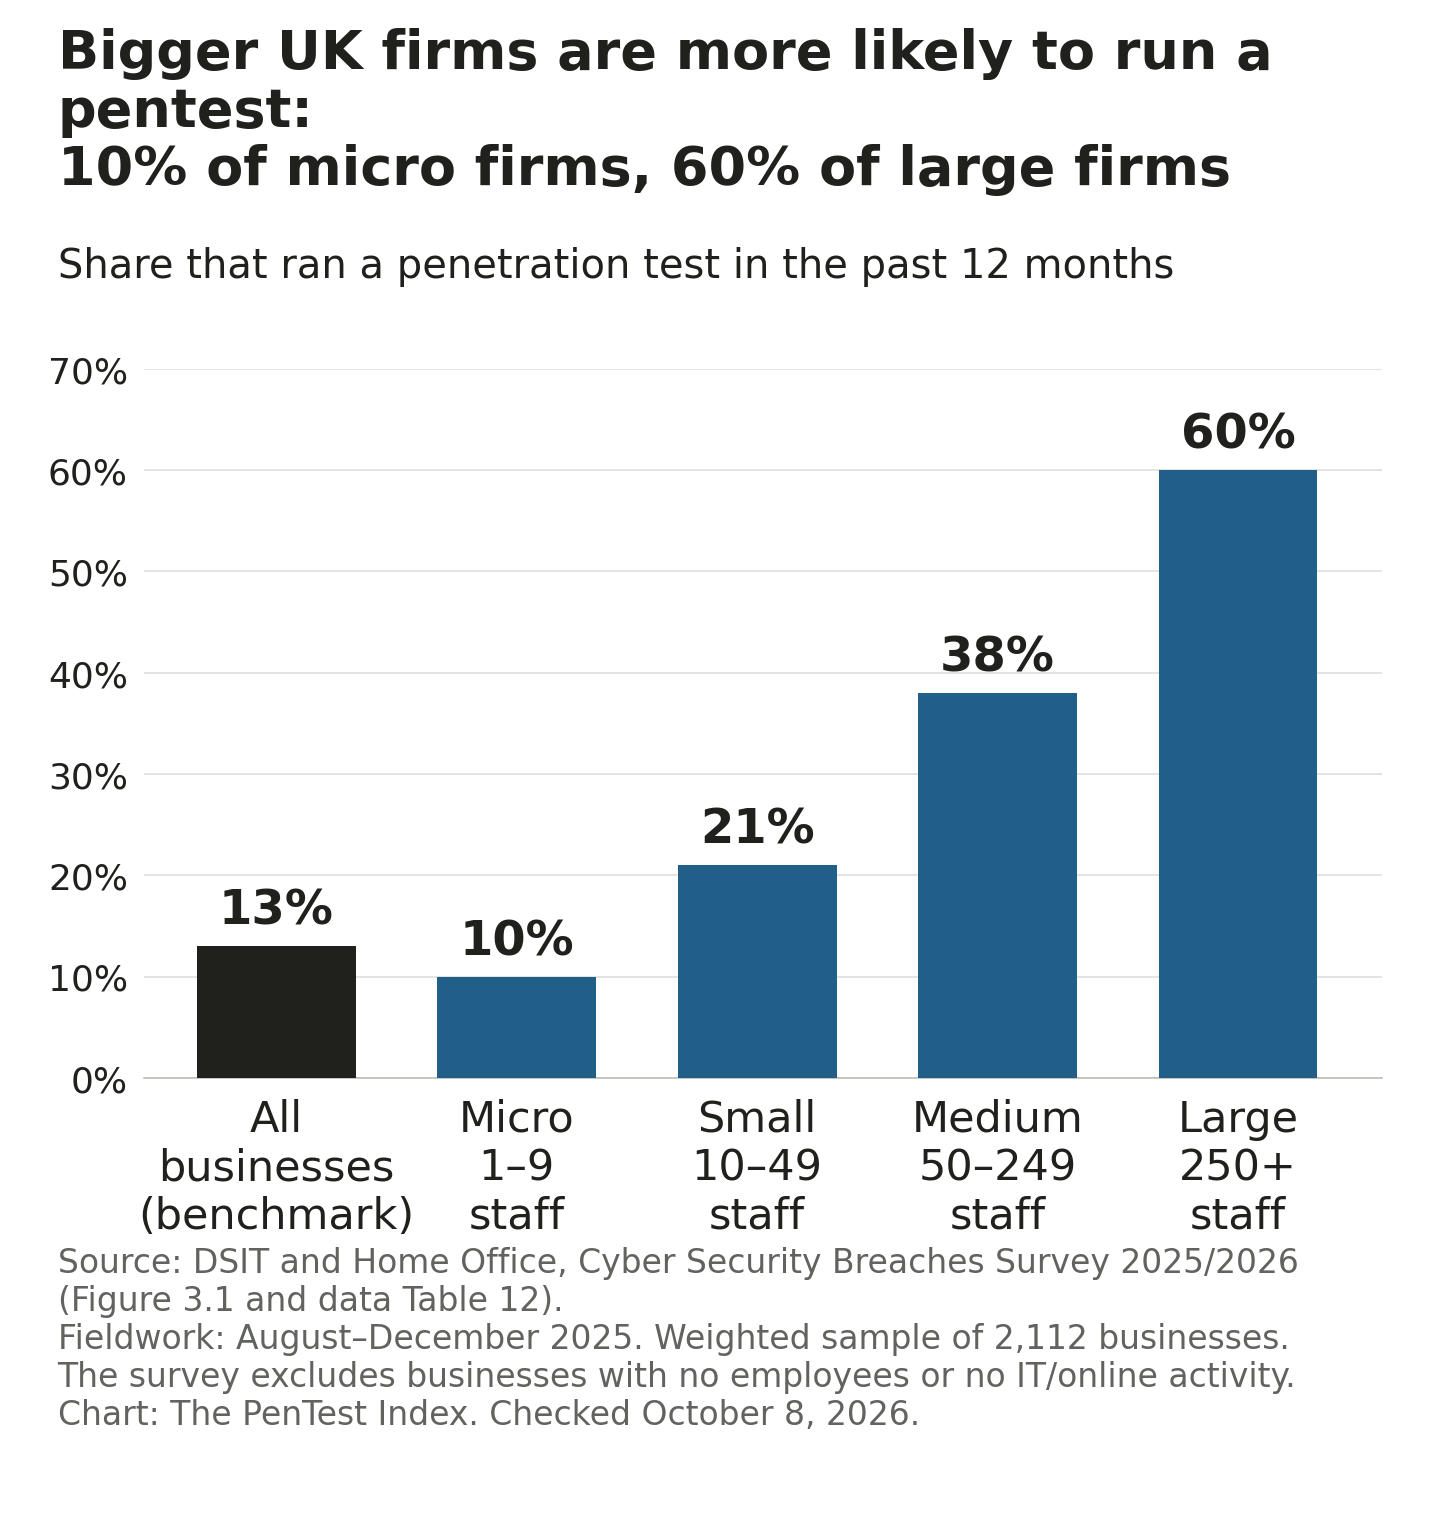
Penetration testing by company size
| Group | Share | Measure | Source |
|---|---|---|---|
| All UK businesses | 13% | Ran a penetration test in the past 12 months | UK Cyber Security Breaches Survey 2025/2026 |
| UK micro (1 to 9 staff) | 10% | Same | Same |
| UK small (10 to 49 staff) | 21% | Same | Same |
| UK medium (50 to 249 staff) | 38% | Same | Same |
| UK large (250+ staff) | 60% | Same | Same |
| UK charities | 7% | Same | Same |
| EU businesses, 10+ staff | 34.6% | Ran ICT security tests of any kind in 2024 | Eurostat |
| EU small (10 to 49 staff) | 29.8% | Same | Eurostat |
| EU medium (50 to 249 staff) | 54.1% | Same | Eurostat |
| EU large (250+ staff) | 78.1% | Same | Eurostat |
| Canada, large businesses (250+ staff) | 45% | Hired an outside party for a penetration test in 2017 | Statistics Canada |
Sources: UK Cyber Security Breaches Survey 2025/2026 (2,112 businesses and 1,085 charities; fieldwork August 11 to December 12, 2025; published April 30, 2026); Eurostat isoc_cisce_ra (updated June 15, 2026); Statistics Canada (historical 2017 measure). All read October 8, 2026.
The UK number is roughly flat: 12% of businesses in the survey published in April 2025, 13% in the one published in April 2026. The EU number has barely moved: 35.2% in 2019, 34.6% in 2022 and 34.6% in 2024.
One more UK comparison: 18% of UK businesses ran a vulnerability audit, against 13% for penetration testing. They aren't the same thing. A vulnerability audit or scan looks for known weak spots. A pentest tries to use them, the way an attacker would.
Penetration testing statistics by country
The EU measure is wider than penetration testing. Eurostat asks whether a business ran "ICT security tests," which includes penetration tests, tests of alert systems, security reviews and backup tests. It covers businesses with 10 or more staff.
Among the 27 EU countries, the share runs from 18.2% in Hungary to 53.4% in the Netherlands. In the EU's four biggest economies it was 42.5% in Germany, 31.8% in Italy, 30.7% in Spain and 26.5% in France.
| Country or area | All, 2024 | 10 to 49 staff | 50 to 249 staff | 250+ staff | All, 2022 | All, 2019 |
|---|---|---|---|---|---|---|
| Netherlands | 53.39% | 47.60% | 73.86% | 86.89% | 50.94% | 50.36% |
| Malta | 52.94% | 47.32% | 73.63% | 82.61% | 49.08% | 43.05% |
| Denmark | 51.32% | 45.81% | 71.40% | 89.42% | 49.66% | 49.34% |
| Belgium | 48.88% | 43.26% | 69.07% | 87.83% | 45.18% | 46.77% |
| Sweden * | 44.08% | 39.36% | 61.11% | 82.41% | 47.25% | 51.61% |
| Finland | 43.19% | 37.58% | 63.65% | 87.14% | 44.42% | 43.74% |
| Germany | 42.51% | 36.99% | 62.14% | 82.95% | 42.57% | 38.67% |
| Norway (not in EU) | 39.05% | 34.13% | 62.17% | 85.36% | 38.16% | 35.83% |
| Portugal | 38.42% | 33.61% | — | 77.90% | 34.94% | 42.65% |
| Luxembourg | 37.21% | 32.10% | 53.71% | 77.23% | 36.51% | 35.66% |
| Poland | 35.54% | 29.78% | 55.47% | 86.01% | 32.44% | 26.95% |
| Cyprus | 35.52% | 31.10% | 56.90% | 87.74% | 38.91% | 36.73% |
| Euro area (average) | 35.33% | 30.42% | 55.57% | 79.00% | 35.69% | 36.84% |
| European Union, 27 countries (average) | 34.64% | 29.76% | 54.07% | 78.10% | 34.56% | 35.18% |
| Czechia | 34.15% | 28.92% | 50.87% | 72.83% | 36.81% | 38.68% |
| Austria | 33.76% | 28.52% | 55.61% | 84.39% | 34.57% | 31.77% |
| Italy | 31.77% | 28.05% | 54.04% | 78.92% | 31.79% | 33.50% |
| Spain | 30.66% | 25.86% | 48.76% | 78.59% | 28.87% | 31.87% |
| Slovakia | 30.01% | 22.97% | 53.21% | 70.56% | 27.85% | 28.81% |
| Ireland | 27.65% | 21.09% | 53.46% | 76.73% | 26.09% | 52.05% |
| Greece | 27.04% | 24.13% | 37.51% | 57.49% | 33.69% | 37.22% |
| Slovenia | 26.65% | 21.26% | 44.85% | 83.33% | 29.13% | 25.94% |
| France | 26.52% | 22.59% | 44.18% | 70.60% | 27.50% | 35.06% |
| Estonia | 26.03% | 20.62% | 47.72% | 71.70% | 31.23% | 27.82% |
| Montenegro (not in EU) | 24.08% | 19.63% | 46.39% | 58.81% | 22.08% | 22.76% |
| Lithuania | 23.87% | 19.51% | 37.13% | 62.19% | 23.30% | 28.26% |
| Türkiye (not in EU) | 23.54% | 19.25% | 40.26% | 68.10% | 24.33% | — |
| Romania | 22.28% | 19.69% | 29.30% | 51.90% | 20.04% | 15.42% |
| Latvia | 22.27% | 17.44% | 41.10% | 69.82% | 21.40% | 32.41% |
| Serbia (not in EU) | 22.19% | 17.94% | 33.21% | 49.99% | 22.98% | 21.63% |
| Croatia | 20.67% | 16.47% | 38.40% | 67.35% | 22.25% | 26.77% |
| Bulgaria | 18.88% | 15.20% | 32.91% | 60.42% | 17.79% | 22.72% |
| Hungary | 18.16% | 14.10% | 34.84% | 66.50% | 14.99% | 19.85% |
| Albania (not in EU) | 16.65% | 14.30% | 25.53% | 32.26% | — | — |
| Bosnia and Herzegovina (not in EU) | 10.86% | 7.78% | 18.44% | 36.44% | 12.69% | 13.73% |
Source: Eurostat, isoc_cisce_ra, indicator E_SECMTST, dataset updated June 15, 2026, read October 8, 2026. Figures as Eurostat prints them. "Highest" and "lowest" in the text mean among the 27 EU countries; two non-EU countries in the table sit below Hungary (Bosnia and Herzegovina 10.86%, Albania 16.65%). * Break in series. — No figure published.
The UK business survey excludes zero-employee businesses, public bodies and businesses with no IT or online activity. Eurostat covers businesses with at least 10 people in its listed sectors; finance is excluded. Its EU and euro-area totals are weighted aggregates, not simple country averages.
Why do company surveys show much higher numbers?
The company surveys here ask security staff, often at larger companies; some only include organizations that already test. Even then, 17% of the people in Fortra's 2024 survey said their organization never pen tests. Pentera's 2024 survey only took companies that already pentest. The UK government survey asks businesses of every size, including the very smallest. The samples answer different questions: 13% of UK businesses reported a test, while 83% of Fortra's respondents test at least once a year.
How often do companies run penetration tests?
Once or twice a year is the most common answer: 43% of the security professionals in Fortra's 2024 survey. In Cobalt's 2025 survey of mid-size and large organizations, 30% said every quarter and 27% said once a year. Systems change faster than that: 96% of large U.S. enterprises change their IT at least every quarter, but only 30% test that often (Pentera, 2025).
| How often | Fortra 2024 | Cobalt 2025 |
|---|---|---|
| Never | 17% | not reported |
| Every two years | not separately listed | 1% |
| Once a year | 43% (once or twice a year) | 27% |
| Twice a year | (included above) | 15% |
| Quarterly | 11% | 30% |
| Monthly | 12% | 18% |
| Weekly, daily or continuously | 17% (weekly 9%, daily 8%) | 8% (continuously) |
Sources: Fortra, 2024 Penetration Testing Report, Figure 8 (sample size not published; 64% of respondents in North America; Fortra sells pen testing tools and services). Cobalt, State of Pentesting Report 2025 (450 security professionals at organizations with 500 to 9,999 staff; Cobalt sells pentests). Read October 8, 2026.
Cobalt's displayed shares sum to 99% because of rounding.
Put Fortra's numbers another way: 83% of respondents test at least once a year (100% minus the 17% who never do).
Why do companies pen test?
Rules are a big reason, but not the only one. 72% of security professionals say pen testing helps them meet and prove compliance with outside regulations or mandates (Fortra, 2024). In Cobalt's 2026 survey, 53% now run testing as an ongoing program, more than the 40% who test mainly for compliance.
Customers are pushing too. 61% of security professionals in Cobalt's 2026 survey say customers ask for third-party pentest reports to check software security. Only compliance certifications are asked for more often.
The report calls this a 13-point increase. Its 2025 report gives 59% for a question about customers and regulators. Those are different wordings, and the published figures do not establish a comparable 13-point rise.
And people believe it works. 72% of Fortra's 2024 respondents said they feel pen testing has prevented a breach at their organization. That's a belief, not a measured result.
How long does a penetration test take?
16 of the 43 providers we checked publish a time for a human test or a testing-day allowance on the checked pricing or service pages. Stated test times run from 1 day to several weeks, and one provider adds "sometimes even months." For a web application test, eight providers give a number: three of the eight say one to two weeks, and the full range is 3 working days to 6 weeks.
| Provider | Shortest time stated | Longest time stated | Web application test |
|---|---|---|---|
| Astra | 8-10 business days | 10-15 working days | 10-14 business days |
| Bishop Fox | one to three weeks of fieldwork | one to three weeks of fieldwork | one to three weeks of fieldwork |
| BreachLock | a few days | a couple of weeks | no separate figure |
| Pentest-Tools.com | 3 working days (best effort) | 7 to 10 business days | 3 working days (black box); 4+ working days (grey box) |
| Synack | 5 day assessment window | 14 or 365 day assessment window (the 365-day option runs all year) | no separate figure |
| Raxis | 1–2 weeks | three to six weeks or more | one to two weeks of active testing |
| Software Secured | one to two weeks | two to four weeks | one to two weeks |
| DeepStrike | 1-3 weeks | 2-4 weeks | 2-4 weeks |
| Prescient Security | 1 day | 6 weeks | no separate figure |
| UnderDefense | up to 5 days (a package of scanning and external tests) | 3-4 weeks | no separate figure |
| TCM Security | 1–3 days | 1–3 weeks | 1–2 weeks |
| Blaze Information Security | 3 credits (one credit is one day of testing) | 7–10 credits on average for many common assessments | no separate figure |
| Vumetric | a couple of days | several weeks, sometimes even months | no separate figure |
| Qualysec | a few days | two to six weeks (automotive) | no separate figure |
| Sekurno | 2 - 4 weeks (AI and LLM test) | ~ 4 weeks (security testing step) | no separate figure |
| Schellman | 1 week | 2–6 weeks; 4 or more weeks for large networks | 2 – 6 weeks |
Source: the checked provider pricing or service pages, read October 8, 2026; exact links are in the download. Blaze sells testing in credits, where one credit is one day of testing effort. Synack's assessment windows describe coverage, including a 365-day option, rather than a promised report time. These are the providers' own words. We did not time any test.
Start times vary as well. 10 providers say on those pages how soon a test done by people can start. The answers run from "within 24 hours" (Astra, Cobalt) to "Scheduling within 3-6 weeks - sometimes sooner" (Software Secured). Two more give a start time elsewhere: Schellman's scoping form says "typically starting new projects 6-8 weeks out," and a Rhino Security Labs FAQ page says "as much as 2-6 weeks out."
The comparison on our homepage shows the stated timing for each selected web application and API offer.
How much of the attack surface gets tested?
Not much. U.S. enterprises whose surveyed staff oversee AI security spending say they test only 32% of their attack surface on average, even though 95% call pentesting a top or high priority (Synack and Omdia, fielded December 2025; 200 people at companies with 1,000 or more staff). The attack surface is everything an attacker could reach.
Is a penetration test required? What 21 rules say, and how often
8 of the 21 entries in our rule tracker are in the group that requires testing, and 5 of those 8 set an annual baseline. Eight mention testing or give guidance. Four do not name it. One—CMMC Level 3—has a suspended contracting rollout, although its annual clause remains in the rule. SOC 2 names it once, as an example.
| # | Rule | What the text says | How often, in the rule's words | Who it covers |
|---|---|---|---|---|
| 1 | PCI DSS v4.0.1, Requirements 11.4.2 and 11.4.3 | Requires a test | At least once every 12 months, and after any significant infrastructure or application upgrade or change | Entities subject to PCI DSS Requirements 11.4.2 and 11.4.3 |
| 2 | FTC Safeguards Rule, 16 CFR 314.4(d)(2) | Requires a test (for some) | Annual penetration testing; vulnerability assessments at least every six months | Financial institutions under FTC jurisdiction, subject to the monitoring alternative and the fewer-than-5,000-consumers exemption |
| 3 | NYDFS Cybersecurity Regulation, 23 NYCRR 500.5(a)(1) | Requires a test (for some) | At least annually | Covered entities under NYDFS Part 500 that are not exempt from section 500.5 |
| 4 | NIST SP 800-53 Rev. 5, control CA-8 (with SP 800-53B baselines) | Requires a test (for some) | Organization-defined frequency | Systems using the NIST SP 800-53B High baseline, subject to control selection and tailoring |
| 5 | FedRAMP legacy Rev. 5 Penetration Test Guidance | Requires a test (with exceptions) | At least every 12 months, unless the authorizing body approves a different interval with documented rationale | Cloud services following FedRAMP legacy Rev. 5 guidance |
| 6 | CMMC Level 3, requirement CA.L3-3.12.1e (32 CFR 170.14(c)(4)) | Rollout suspended; annual clause remains | CFR text: at least annually or when significant security changes are made; contracting rollout suspended | CMMC Level 3 contractor systems; new Level 3 contract designations are suspended |
| 7 | EU Digital Operational Resilience Act (DORA), Regulation (EU) 2022/2554, Article 26 | Requires a test (for some) | Threat-led penetration testing at least every 3 years; the competent authority may increase or reduce frequency | Financial firms named by their regulator for advanced testing |
| 8 | IRS Publication 1075, control CA-8 | Requires a test | Every 3 years | Agencies and contractors that receive federal tax information |
| 9 | GovRAMP (formerly StateRAMP) Penetration Testing Requirements Guide | Requires a test (with exceptions) | At least every 12 months, unless the authorizing body approves a different interval with documented rationale | Cloud services subject to the GovRAMP penetration-testing guide |
| 10 | SOC 2 (AICPA Trust Services Criteria, point of focus under CC4.1) | Example or guidance | None stated | Service organizations that get a SOC 2 report |
| 11 | EU NIS2 Directive (EU) 2022/2555 and Implementing Regulation (EU) 2024/2690 | Example or guidance | Security-test type and frequency follow the entity's risk assessment; no fixed pentest interval | Essential and important entities; listed digital providers |
| 12 | NIST Cybersecurity Framework 2.0 (implementation example for ID.IM-02) | Example or guidance | None stated | Any organization; adoption is voluntary unless a policy requires it |
| 13 | Swift Customer Security Controls Framework v2026, control 7.3A | Advisory | At least every 2 years (advisory) | Banks and other organizations on the Swift network |
| 14 | FDA guidance: Cybersecurity in Medical Devices: Quality Management System Considerations and Content of Premarket Submissions | Nonbinding guidance | None stated | Medical device makers filing premarket submissions |
| 15 | TSA Security Directive Pipeline-2021-02G | Example in a required plan | None for penetration tests | Critical pipeline and LNG operators notified by TSA |
| 16 | MAS Technology Risk Management Guidelines, section 13.2 | Guidance | At least once annually or after major changes or updates for directly internet-accessible systems (guidance) | Financial institutions in Singapore |
| 17 | HIPAA Security Rule in force (45 CFR Part 164, Subpart C) | No named penetration test | None; a "periodic technical and nontechnical evaluation" is required | Covered health plans, clearinghouses, covered health-care providers and their business associates |
| 18 | CMMC Level 2 (NIST SP 800-171 Rev. 2) | No named penetration test | No named pentest; security controls assessed periodically, at an organization-defined interval of no more than one year | Defense contractors handling controlled unclassified information |
| 19 | NERC CIP-010-4, Requirement R3 | No named penetration test | Paper or active vulnerability assessment at least every 15 calendar months; active assessment at least every 36 calendar months for high impact systems, where technically feasible | Responsible entities with applicable high or medium impact BES Cyber Systems and associated systems |
| 20 | ISO/IEC 27001:2022, Annex A (controls 8.8 and 8.29) | No named penetration test | None stated | Organizations certified to ISO/IEC 27001 |
| 21 | FBI CJIS Security Policy v6.1 | Mentions tests; requires access for FBI testing | None for the agency's own testing | Agencies and vendors that handle criminal justice information |
Source: each entry's text, checked October 8, 2026 (quotes, source links and exceptions in the download). PCI DSS was checked in the PCI council's Prioritized Approach document. The ISO-authored full standard was read through a public mirror, not a licence owned by this site. These counts cover this selected tracker, not every security rule.
Proposed, not in force: a HIPAA Security Rule update would require a penetration test at least once every 12 months, or more often if the risk analysis calls for it, plus vulnerability scans at least every six months (proposed 45 CFR 164.312(h)(2)(iii)). HHS proposed it on January 6, 2025. It was still not final on October 8, 2026.
Rules that require a test
Eight entries are in the group that requires testing. Five set an annual baseline: PCI DSS, the FTC Safeguards Rule, New York's financial regulation (NYDFS), FedRAMP's legacy guidance and GovRAMP. DORA and IRS Publication 1075 set a three-year baseline; DORA lets the regulator increase or reduce that frequency. NIST SP 800-53 lets each organization set its own timing.
The scope and exceptions matter. The FTC testing provision applies when the firm lacks effective continuous monitoring or another system that continually detects changes that may create vulnerabilities. Institutions with customer information on fewer than 5,000 consumers are exempt from that provision, not the whole rule. NYDFS has small-firm and other exemptions. NIST SP 800-53B selects the control only in its High baseline, subject to tailoring. DORA's threat-led test applies only to financial firms their regulator names. FedRAMP and GovRAMP allow a documented exception approved by the authorizing body. Each source and exception is in the rule-tracker download.
CMMC Level 3 is listed separately. Its rule still says to test at least annually or after significant security changes. The July 2026 suspension and implementation memo bar new Level 3 contract designations and direct changes to solicitations and contracts. Existing contract terms may remain until the next option or administrative change. The rule was not repealed.
Rules that mention testing or give guidance
Eight entries mention penetration testing or give guidance: SOC 2, the EU's NIS2, the NIST Cybersecurity Framework 2.0, Swift's customer security controls, FDA medical device guidance, the TSA pipeline directive, Singapore's MAS guidelines and the FBI CJIS Security Policy. They do not set a general duty for every covered organization to commission its own test. Some do have other duties: the TSA requires an assessment plan, and the FBI requires specified connected entities to allow FBI tests.
For SOC 2, that means the criteria list penetration testing once, as one way a company can check its controls. The company's own controls or customer commitments can still call for a test.
Swift's v2026 control is advisory: it calls for tests at least every two years and full coverage of in-scope components at least every four years. MAS guidance expects at least annual tests, or tests after major changes, for systems reached directly from the internet. Neither interval belongs in the five-rule annual requirement count.
Rules that don't name penetration testing
Four texts do not name a penetration test: the HIPAA Security Rule in force today, CMMC Level 2's NIST SP 800-171 Rev. 2 requirements, NERC CIP-010-4 and ISO/IEC 27001:2022. HIPAA asks for a "periodic technical and nontechnical evaluation." NERC asks for paper or active vulnerability assessments at least every 15 calendar months; its high-impact active assessment is due at least every 36 calendar months where technically feasible.
A payment company covered by PCI DSS Requirement 11.4 must test every 12 months. A health clinic under HIPAA has no such line in the rule today.
This table reports what each text says. It isn't legal advice. The rules that apply to an organization also depend on its scope, exemptions, contracts and chosen controls.
What changed in 2025 and 2026
- January 6, 2025: HHS proposed the HIPAA update with a yearly penetration test. It's still not final. The federal agenda lists July 2027 as a target for final action, not a legal deadline.
- January 17, 2025: DORA began to apply in the EU.
- March 31, 2025: the last new PCI DSS v4 requirements took effect, including 11.4.7 for multi-tenant service providers (companies that host many customers on shared systems).
- November 10, 2025: the U.S. defense contract rule that puts CMMC into contracts took effect.
- February 3, 2026: the FDA reissued its premarket cybersecurity guidance for medical devices.
- June 24–25, 2026: FedRAMP's ruleset changelog calls June 24 the launch; its announcement is dated June 25. The overall transition is January 1, 2027, with separate dates for some rules. Vulnerability-detection rules start December 7, 2026, with a grace period through March 7, 2027. Annual independent-assessment rules for ongoing certifications start January 1, 2027, with grace until the first assessment started after that date.
- July 13, 2026: the CMMC Phase II rollout was suspended. The implementation memo also bars new Level 3 designations. Level 1 and Level 2 self-assessments continue.
What do penetration tests find?
How much of what testers find is serious depends on who's counting. Cobalt rates 12% of findings high risk (five years of tests, 2026 report). Edgescan rates 31.9% of flaws in internet-facing web applications and APIs critical or high, and Synack rates 37% critical or high (both 2025 data). Each company grades in its own way.
| Publisher | What was counted | Sample and period | Headline number | Read in |
|---|---|---|---|---|
| Cobalt | Its customers' pentest findings | 16,500+ pentests at nearly 3,000 organizations; five years | 12% of findings rated high risk; 32% in AI and LLM apps | Full report |
| Edgescan | Vulnerabilities in internet-facing web apps and APIs | Edgescan customers; 2025 | 31.9% critical or high | Full report |
| Synack | Vulnerabilities its testers found for clients | 11,646 vulnerabilities; 2025 | 37% critical or high | Full report |
| BreachLock | High and critical web app findings | 531,770 findings from 4,970 tests; 2026 report | Broken access control most common, at 27% | Publisher's summary |
| CISA | Risk and vulnerability assessments by CISA and the U.S. Coast Guard | 143 assessments; fiscal year 2023 | Valid accounts behind 41% of successful first break-ins | Full report |
Sources: Cobalt 2026; Edgescan 2026; Synack 2026; BreachLock 2026; CISA FY2023. Cobalt, Edgescan, Synack and BreachLock sell testing. Read October 8, 2026.
Two Cobalt numbers can both be right. 12% of all findings are high risk. Leave out the low-level "informational" findings and it's about 13%. Same data, different starting pile. Always check what a percentage is a share of.
The most common serious web problem in BreachLock's tests was broken access control, where people can reach data or actions they shouldn't. Cross-site scripting, a flaw that lets an attacker run code in someone else's browser, was the most frequent finding in Synack's 2025 data.
Penetration test findings by industry
The share of findings rated critical or high was 43.1% in manufacturing, 40.0% in technology, 39.4% in government, 32.4% in retail and 31.4% in financial services (Synack, 2025 data). For how fast each industry closes its findings, see the half-life table below.
How testers get in
In 143 risk and vulnerability assessments by CISA and the U.S. Coast Guard, a real, working login was the most successful way in. Valid accounts were behind 41% of successful first break-ins (CISA, fiscal year 2023).
How long does it take to fix what a penetration test finds?
38 to 58 days—about 5 to 8 weeks—is the range of serious-flaw repair and resolution benchmarks in four reports published in 2026. The reports use different measures, so this is not one industry average. The range is about three to four times the two-week target that three-quarters of respondents set in a 2025 Cobalt survey.
To picture 38 to 58 days, count forward from March 1: that lands between April 8 and April 28. These dates illustrate the benchmarks; they do not predict when a particular flaw will be fixed.
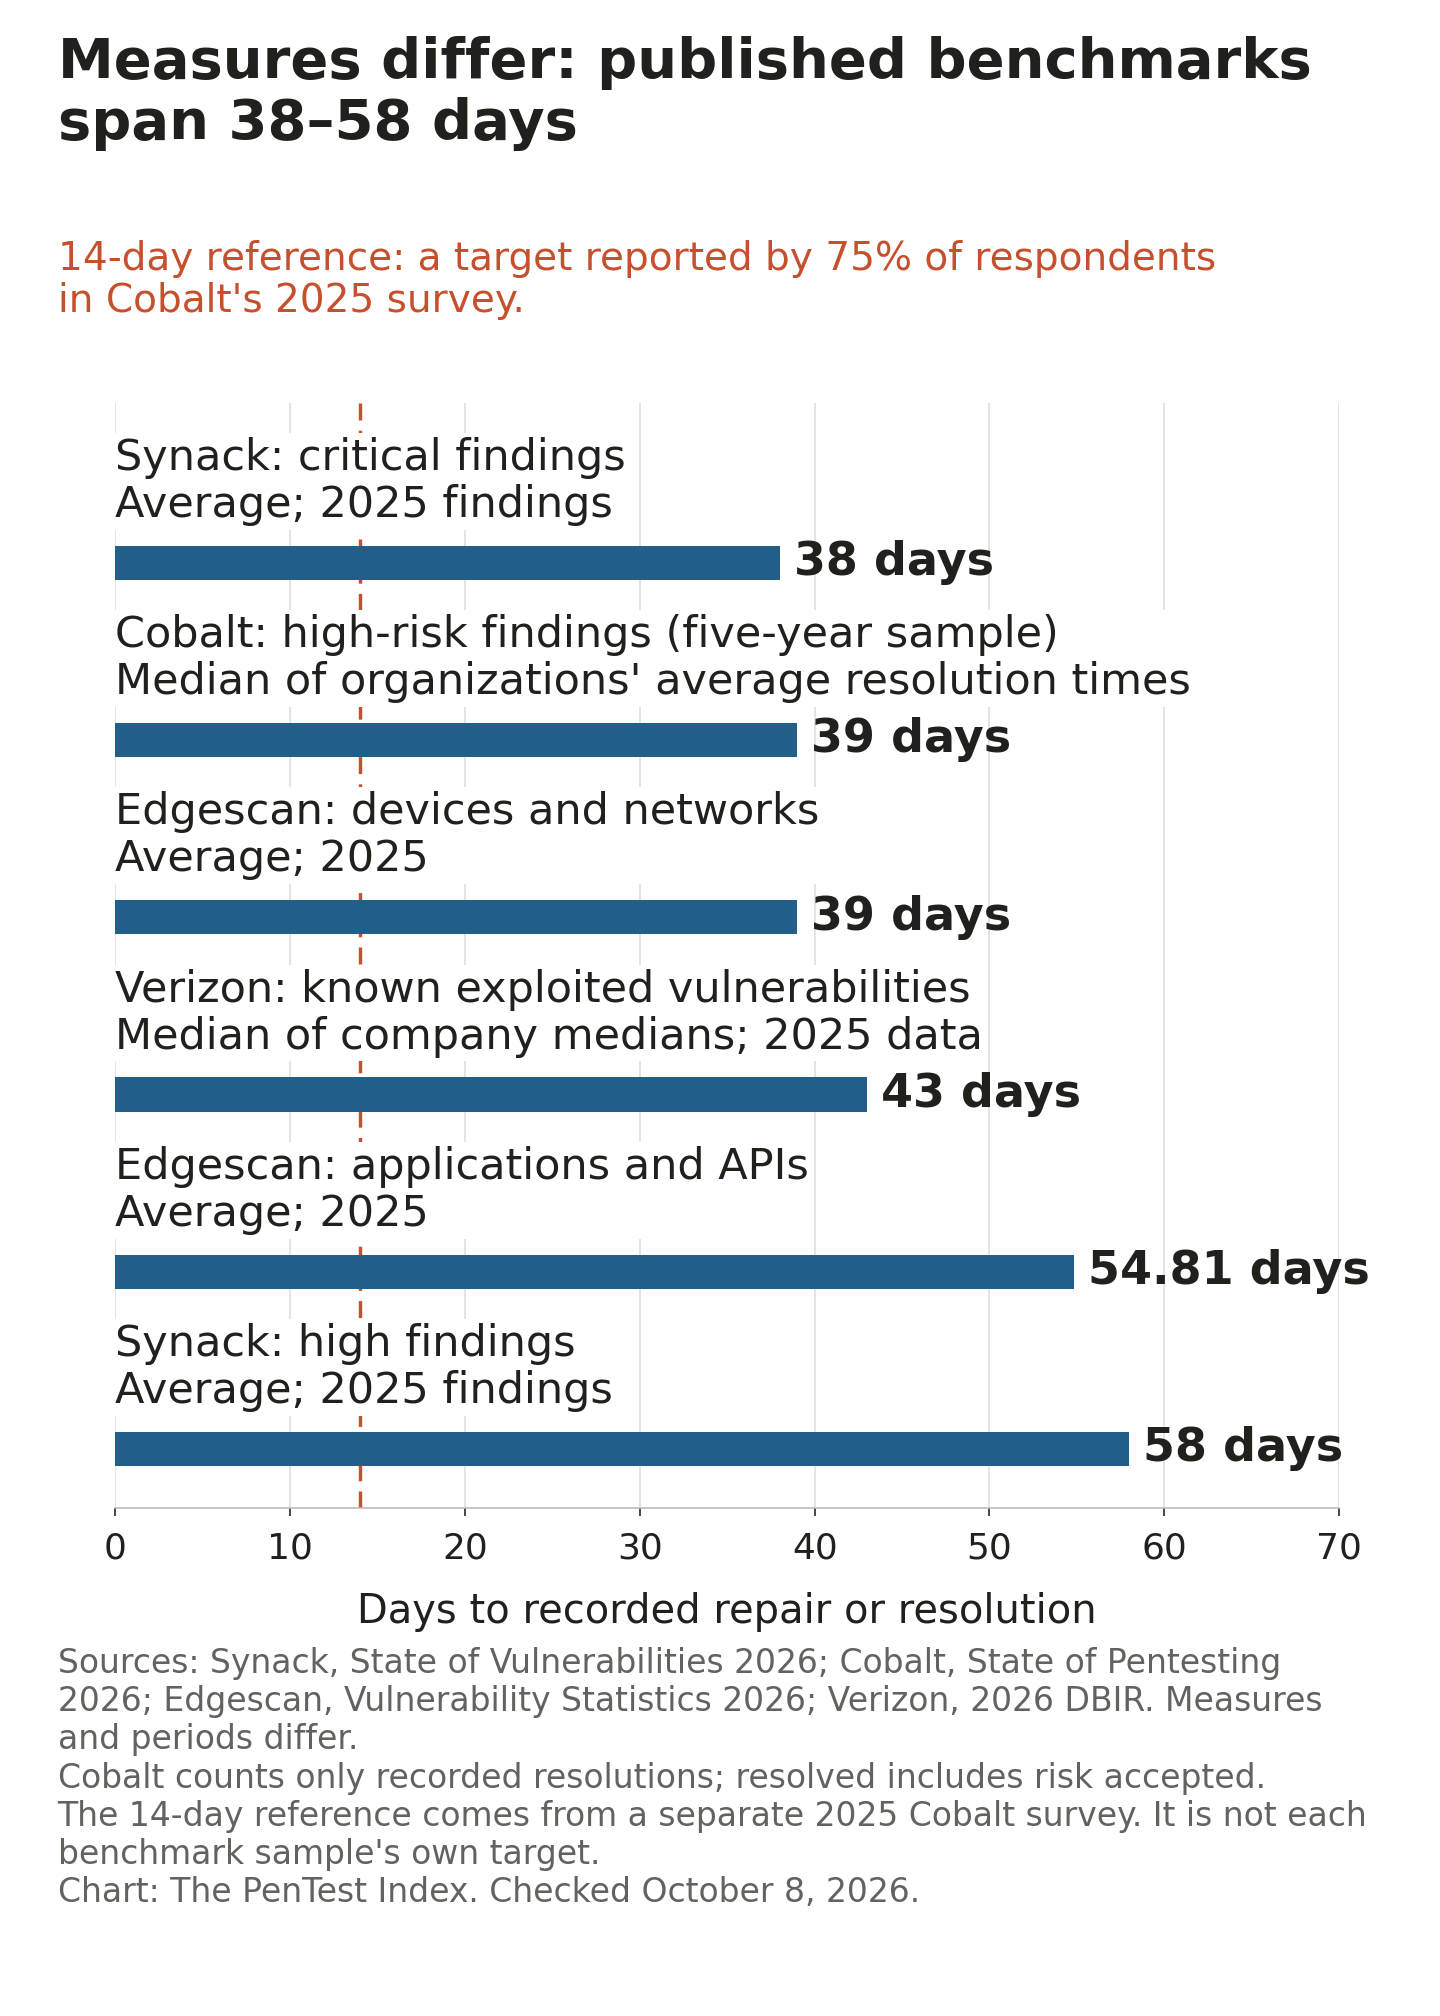
| Report | What it covers | Days | Measure |
|---|---|---|---|
| Synack, 2026 State of Vulnerabilities Report | Critical findings | 38 | average |
| Cobalt, State of Pentesting Report 2026 | High-risk findings | 39 | median of organizations (MTTR) |
| Edgescan, 2026 Vulnerability Statistics Report | Devices and networks | 39 | average |
| Verizon, 2026 Data Breach Investigations Report | Known exploited vulnerabilities | 43 | median |
| Edgescan, 2026 Vulnerability Statistics Report | Applications and APIs | 54.81 | average |
| Synack, 2026 State of Vulnerabilities Report | High findings | 58 | average |
Sources: Synack, Cobalt (Figure 15), Edgescan and Verizon, all published in 2026 and read October 8, 2026. Two are medians and four are averages, and each covers a different kind of flaw. Cobalt's 39 days counts only the findings that were resolved, and its "resolved" includes accepted risk.
What "resolved" means
Cobalt counts a finding as resolved when the customer marks it resolved or accepts the risk in Cobalt's platform. A finding the customer never reported back on counts as unresolved, even if it was quietly fixed. The unresolved group includes findings confirmed open and findings with no reported resolution. Cobalt itself says its numbers are "probably a conservative view of reality."
The gap between fast and slow teams
Among Cobalt's customers, half of high-risk findings are resolved within 45 days at the median organization. The fastest tenth of organizations get there in 10 days. The slowest tenth take 249 days. That's 25 times longer, or about eight extra months.
Cobalt calls this the "half-life": the time until half of the findings are resolved. It's a fuller measure than average fix time, because it also counts the findings not yet resolved.
Which industry fixes pentest findings fastest?
Software. Across 10 industries in Cobalt's data, the half-life of high-risk findings runs from 38 days in software to 98 days in entertainment. That's a 60-day spread. Healthcare and finance sit in the middle at 55 days each.
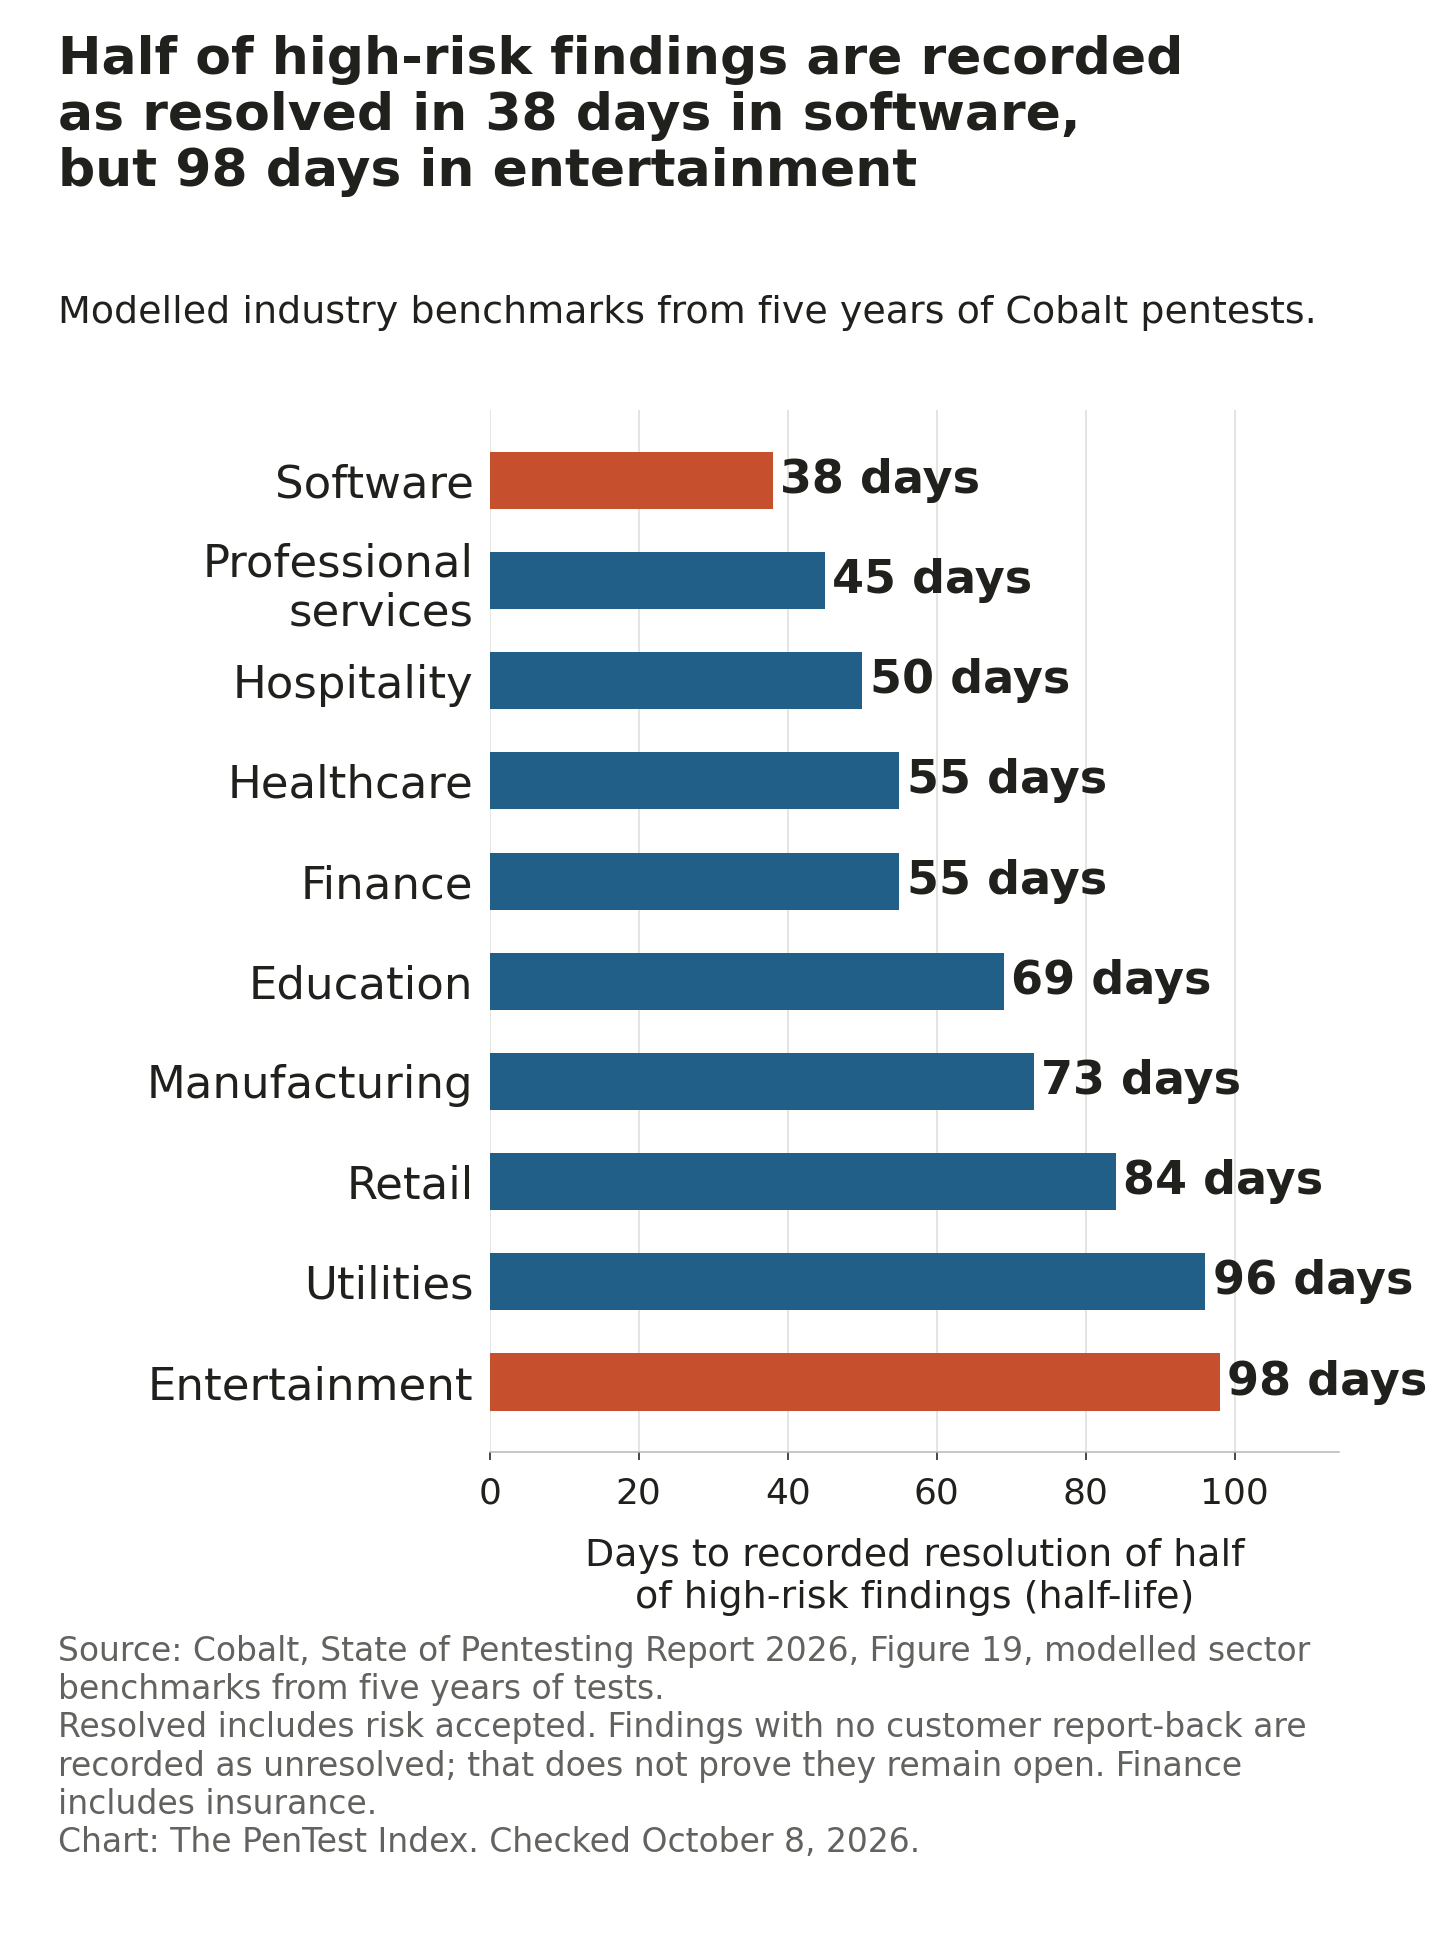
| Rank (fastest first) | Industry | Half-life of high-risk findings (days) |
|---|---|---|
| 1 | Software | 38 |
| 2 | Professional services | 45 |
| 3 | Hospitality | 50 |
| 4 (tie) | Healthcare | 55 |
| 4 (tie) | Finance | 55 |
| 6 | Education | 69 |
| 7 | Manufacturing | 73 |
| 8 | Retail | 84 |
| 9 | Utilities | 96 |
| 10 | Entertainment | 98 |
Source: Cobalt, State of Pentesting Report 2026 (Figure 19). The values are printed in the text of Cobalt's sector posts on software, healthcare and finance, read October 8, 2026. These are modelled benchmarks from one provider's customers, not a safety ranking of whole industries. Finance combines financial services and insurance.
Two measures can tell different stories. Healthcare takes 37 days on average to resolve the high-risk findings it does resolve. That's faster than finance (46 days) and even software (38 days). Its half-life is 55 days. That measure also includes findings not yet resolved; the average only uses completed ones.
| Industry | Share of findings rated high risk | High-risk findings resolved | Average days to resolve | Half-life (days) |
|---|---|---|---|---|
| Software | 9% | 86% | 38 | 38 |
| Professional services | 8% | 86% | 42 | 45 |
| Hospitality | 18% | 91% | 40 | 50 |
| Healthcare | 9% | 86% | 37 | 55 |
| Finance (financial services and insurance) | 9% | 86% | 46 | 55 |
| Education | 10% | 86% | 52 | 69 |
| Manufacturing | 10% | 75% | 44 | 73 |
| Retail | 9% | 69% | 41 | 84 |
| Utilities | 11% | 86% | 58 | 96 |
| Entertainment | 8% | 86% | 36 | 98 |
Source: Cobalt State of Pentesting Report 2026, Figure 19, checked visually across all four columns. “Resolved” includes risk accepted; the time average only counts resolved findings. The source also prints three sectors in its posts for software (July 30, 2026), healthcare and finance (August 18, 2026), drawn from the State of Pentesting Report 2026 dataset. Read October 8, 2026.
What gets fixed, and what stays open
A typical Cobalt customer records 86% of its high-risk findings as resolved or risk-accepted. The lowest tenth of organizations resolve 31% or less, and the top tenth 96% or more (Cobalt, 2026 report). Counted another way, as a share of all findings of every level, 48% were recorded as resolved (Cobalt, 2025 report; tests from 2015 to 2024).
Size matters. Among Cobalt's customers, small companies resolved 81% of serious findings against 60% at large ones, in 27 days against 61 (Cobalt, 2025 report).
Elsewhere, 37% of flaws found in a year are still open at the end of it at enterprises with 1,000 or more staff (Edgescan, 2026 report). Only 26% of known exploited vulnerabilities on organizations' systems got fully fixed, down from 38% a year earlier (Verizon, 2026 report). Reports sent through HackerOne took 62 days on average to resolve, down from 135 days two years earlier (HackerOne, July 2025 to June 2026).
Why so slow? 62% of security professionals say a lack of resources to act on findings or fix them is a challenge for their pen testing program, the most common challenge named (Fortra, 2024).
How much does a penetration test cost?
Published U.S.-dollar starting prices for one test not sold as AI-run range from US$3,000 to US$12,400 across 10 offers from two providers. The two AI-run single-test references with an explicit U.S.-dollar currency are US$1,500 per asset and US$4,000 per web application. About two in three providers showed no price on the current pricing or service pages we checked: 28 of 43 on October 8, 2026.
Who shows a price?
| Result | Providers | Share |
|---|---|---|
| A price for a test or a testing plan on a pricing or service page | 15 | 35% |
| No price on the checked current pricing or service pages | 28 | 65% |
| ...of which: a figure for its own tests only in a blog post, FAQ page, news post or older page | 7 | 16% |
| ...of which: no price for its own tests found on any checked page | 21 | 49% |
Source: The PenTest Index published price check, 43 providers' own websites, read October 8, 2026. The 43 are the 8 in our comparison plus 35 other well-known providers we picked. It isn't a random sample.
One judgment call: BreachLock's current pricing page shows no figure, but an older pricing page that is still online says "Starts at $ 2,500." We counted that as "elsewhere." Count it as a pricing page and the tally is 27 of 43, not 28.
No price found for its own tests on the pages we checked: Bishop Fox, NetSPI, HackerOne, Bugcrowd, Rapid7, CrowdStrike, Coalfire, NCC Group, Trustwave (LevelBlue), Secureworks (Sophos), TrustedSec, Black Hills Information Security, Packetlabs, Horizon3.ai, Pentera, Oneleet, Qualysec, Sekurno, A-LIGN, RunSybil and Terra Security.
Published penetration testing prices, provider by provider
| Provider | Published figure | Unit |
|---|---|---|
| Astra | $2,999 per year (AI-run); $5,999 per year (testers plus AI agents); Enterprise says both Contact us and from $9,999 per year | per year, per target |
| Cobalt | $3,500 per test (AI-run; promotion requires the test to start and finish before December 31, 2026) | per test, web application |
| Intruder | $4,000 per test (AI-run; $3,500 for platform subscribers) | per test, web application |
| Pentest-Tools.com | $3,400 fixed (black box web app); $3,400 plus $900 per user role (grey box, so $4,300 for one role) | per test, web application |
| Synack | From $4,181 (AI-run); from $10,283 and $27,120 (tests by people); each requires the Synack Platform, priced separately | test fee plus required platform |
| Raxis | From about $3,500 (external network test); from $25,000 a year (PTaaS) | per test; per year |
| Software Secured | From $5,400 (mobile app on the pricing page; external network); $7,700 (internal network); $10,800 (web and API; AI; IoT); $12,400 (hardware); PTaaS from $21,400 | USD per test; PTaaS subscription period not stated |
| Aikido | $4,000 typical (AI-run); a second tier priced by scope, from $50 to $30,000 or more | per assessment |
| Prescient Security | From $3,000 and from $6,000; $1,500 per asset (AI-run, one time); $850 a month per asset (AI-run) | USD per test or asset, excluding taxes |
| UnderDefense | From $5,000; from $8,000; from $12,000 | per test package |
| Sprocket Security | $15,000 starter package; internal network add-on $13,000 ($28,000 combined) | continuous testing package; billing period not stated |
| Blaze Information Security | From $4,999; from $7,499; from $8,999 (mobile apps $500 more); annual plans $19,999 to $53,999 for 15 to 50 testing-day credits | one-off test, one target; annual credit plan |
| Vumetric | $7,000 typical project (startup program: under 3 years old and fewer than 15 employees) | per project; dollar currency not named |
| Schellman | No less than $13,000 (wireless) to no less than $30,000 (authenticated web app), across ten test types | per test, minimum |
| Hadrian | From 1,250 euros (AI-run) | per test, excluding VAT |
Source: each provider's own pricing or service pages, read October 8, 2026. These are fixed, typical, starting or minimum figures for different jobs, so they are not like-for-like, and none is a quote. The download preserves all 54 offer records, their exact price wording, required extras, currency and source links. Dollar figures are shown as printed; some pages do not name the currency. Intruder has separate USD, GBP and EUR prices; this table uses its USD prices. Its $3,500 subscriber rate requires a separate platform subscription. Synack's three test fees are excluded from complete one-test price summaries because its required platform is priced separately.
Software Secured's pricing page says mobile testing starts at $5,400 USD, while its mobile service page says $10,800 USD. Prescient calls its $1,500-per-asset option non-recurring, but the same card also says one test per month. The download keeps both conflicts. Aikido's $4,000 is a typical reference, not a maximum: the same page gives a $50–$30,000+ range based on scope.
| Provider | Figure | Where |
|---|---|---|
| BreachLock | "Starts at $ 2,500" | Older pricing page still online |
| Rhino Security Labs | About $10,000 and up | Separate FAQ page |
| Red Sentry | From $4,200 | Blog post |
| DeepStrike | From about $5,000 | Blog post |
| XBOW | From $4,000 | News post, November 2025 |
| Strike | Under US$2,000 for a continuous subscription; billing period not stated | Guide page |
| TCM Security | $5,000 to $20,000 for an external network test | Article metadata dated July 12, 2024; body refers to 2025 |
Source: The PenTest Index published price check, read October 8, 2026.
Published U.S.-dollar starting prices for one test not sold as AI-run range from US$3,000 to US$12,400 across 10 offers from two providers. These come from Prescient Security and Software Secured. The CSV marks each included row.
Across those pricing and service pages, 30 offers from 8 providers give a dollar figure for one test not sold as AI-run, without a separate required platform fee. The fixed, typical, starting or minimum figures run from $3,000 (Prescient Security, compliance test) to $30,000 (Schellman, signed-in web application test). Some pages do not name the dollar currency, and the jobs differ, so this is not a like-for-like price comparison.
The most a federal contractor may charge per hour
GSA publishes the maximum hourly prices awarded under each contractor's contract for each labor category. These are called ceiling rates. For titles containing "penetration" and "tester," the median is $157.53 an hour. Agencies often negotiate lower prices.
| Group | Rate records | Median | Middle half | Lowest | Highest |
|---|---|---|---|---|---|
| All matching labor categories | 417 | $157.53 | $126.80 to $196.87 | $57.34 | $320.56 |
| 0 to 2 years of experience required | 96 | $130.69 | $108.17 to $154.12 | $57.34 | $273.34 |
| 3 to 5 years of experience required | 163 | $152.19 | $125.68 to $179.40 | $69.36 | $301.62 |
| 6 to 9 years of experience required | 116 | $181.22 | $150.21 to $211.81 | $84.02 | $307.17 |
| 10 or more years of experience required | 42 | $195.60 | $175.61 to $228.55 | $126.59 | $320.56 |
Source: The PenTest Index analysis of GSA CALC+ ceiling rates, checked October 8, 2026. We queried "penetration" and kept every title containing both "penetration" and "tester": 417 rate records from 135 vendors on 139 contracts, under 149 distinct job titles. This includes two software developer/tester titles. The source snapshot is stamped October 9, 2026 at 02:00:03 UTC, which is October 8 in the site's time zone. "Middle half" is the 25th to 75th percentile, calculated before rounding rates.
Say one tester works one 40-hour week at the median ceiling rate. Using the unrounded rate, that comes to $6,301. It's arithmetic on a ceiling rate, not a quote.
What large companies budget for pentesting
Large U.S. enterprises spent an average of about $300,000 on penetration testing in 2025, about 12% of their security spending, not counting salaries. Nearly 70% plan to raise that budget in 2026, mostly by 1% to 10% (Pentera, AI Security & Exposure Benchmark 2026; 300 U.S. security leaders at organizations with 3,000 or more employees).
An earlier Pentera survey of a different group put the figure at $187,000 for 2024, about 10.5% of the IT security budget (200 U.S. security chiefs, fielded January 2025). Because the groups differ, don't read the two as a trend. Either way, this is a yearly program budget, not the price of one test.
What a breach costs
The average data breach cost $4.99 million worldwide and $11.5 million in the United States (IBM, Cost of a Data Breach Report 2026). Breaches at organizations that use offensive security testing, including red teaming, penetration testing and vulnerability testing, cost $211,339 less than the average. That's a link in survey data, not proof that testing caused the saving.
If you're comparing these prices for your own project, Find My PenTest Match shows what to compare and gives you a scope checklist to send to providers. It's free, and no contact details are required.
How is AI changing penetration testing?
In Cobalt's tests, AI applications turn up a bigger share of serious problems, and fewer of them get resolved. 32% of findings in tests of AI applications are high risk, against 12% across all tests. Only 38.4% of those high-risk AI findings are recorded as resolved, against 77.3% for APIs (Cobalt, 2026 report; five years of tests).
AI here means two different things. One is testing AI systems, such as chatbots built on an LLM (the kind of AI behind chatbots). The other is using AI to run the tests. Both are below.
Do AI findings get fixed?
| Test type | High-risk findings recorded as resolved | No record of resolution |
|---|---|---|
| API | 77.3% | 22.7% |
| Web application | 73.7% | 26.3% |
| External network | — | — |
| Mobile application | 71.2% | 28.8% |
| Cloud | 63.5% | 36.5% |
| Internal network | 54.1% | 45.9% |
| Desktop | 40.2% | 59.8% |
| AI and LLM application | 38.4% | 61.6% |
Source: Cobalt, State of Pentesting Report 2026, Figure 7; five years of Cobalt pentests; read October 8, 2026. "Resolved" means marked resolved or risk-accepted. The external-network label prints “72.%”; the missing digit makes its exact value unusable. It stays blank here and in the CSV.
That's a gap of 38.9 percentage points between APIs and AI apps (77.3 minus 38.4). Out of every 100 serious findings, about 23 in API tests and about 62 in AI app tests have no recorded resolution or risk acceptance. The AI figure is improving: Cobalt says it rose from 21% in its previous report to 38% in this one.
Will AI replace penetration testers?
The surveys show limited trust in fully AI-run testing. They do not measure future job replacement. Teams are trying AI testers but not handing over the keys.
| Statistic | Source | Period |
|---|---|---|
| 87.8% of security practitioners who use AI tools to generate findings say those findings need significant manual checking at least sometimes. | Pentest-Tools.com, The state of AI pentesting survey (June 2026) | fielded June 17-18, 2026 |
| 32% of findings in tests of AI and LLM applications are high risk, against 12% across all penetration tests. | Cobalt, State of Pentesting Report 2026 (Figure 6) | a five-year period (years not stated) |
| Only 38.4% of high-risk findings in AI and LLM applications are recorded as resolved, against 73.7% for web applications and 77.3% for APIs: a gap of 38.9 percentage points between APIs and AI apps. | Cobalt, State of Pentesting Report 2026 (Figure 7) | a five-year period (years not stated) |
| Nine providers put a number on how fast an AI-run penetration test returns results. Seven of the nine say within 48 hours, and six of those say the same day or within 24 hours. | The PenTest Index, Published price check (timing columns; see pentest-published-price-check-2026-10-08.csv) | checked October 8, 2026 |
| 87% of U.S. enterprises in Synack and Omdia's survey were planning, piloting or using agentic AI for penetration testing. Respondents oversaw AI security spending. | Synack and Omdia, The 2026 State of Agentic AI in Pentesting | fielded December 11–22, 2025 |
| Only 9% of security teams would rely on AI-run penetration testing for all their needs. It was 29% in a different group surveyed a year earlier. | Cobalt, AI and Pentesting Pulse Report 2026 | 2026 |
| 78% of security teams say automated testing tools have missed real problems. | Cobalt, AI and Pentesting Pulse Report 2026 | 2026 |
| 19% of organizations say they had a security incident involving AI or LLM tools in the past year. | Cobalt, State of Pentesting Report 2026 | 2026 edition |
| 58% of North American security teams surveyed already use penetration testing as a service (PTaaS). | Omdia for Cobalt, Next-generation Offensive Security Strategies Give Defenders the AI Advantage | fielded May 2026 |
| 64% of respondents in Synack and Omdia's U.S. enterprise survey preferred AI agents to lead penetration tests with people overseeing them. | Synack and Omdia, The 2026 State of Agentic AI in Pentesting | fielded December 11–22, 2025 |
Sources: as listed in each row; full details in the download. Every survey here was paid for by a company that sells testing.
What AI-run tests cost and how fast they are
The two AI-run single-test references with an explicit U.S.-dollar currency are US$1,500 per asset and US$4,000 per web application. These are Prescient Security's non-recurring card and Intruder's standalone web-app test.
Four providers give a fixed, typical or starting dollar figure for one AI-run test on a pricing or service page, from $1,500 per asset (Prescient Security) to $4,000 (Intruder and Aikido). Aikido also shows $50–$30,000+ pricing based on scope. Synack lists $4,181 plus a required, separately priced platform. Hadrian starts at 1,250 euros per test, excluding VAT. Tests not sold as AI-run have dollar figures from $3,000 to $30,000. Some pages do not name the dollar currency, and the jobs differ, so the prices are not like-for-like.
Nine providers put a number on how fast an AI-run test returns results. Seven of the nine say within 48 hours, and six of those say the same day or within 24 hours. The other two say "within two to five business days" (Bishop Fox) and "initial baseline results in 1–2 weeks" (Terra Security). Several of these tests have people check the results. These are the providers' own claims, read October 8, 2026.
| Provider | Time stated | Group |
|---|---|---|
| Astra | "First report on the same day" | Same day or within 24 hours |
| Bishop Fox | "within two to five business days" | Does not promise results within 48 hours |
| Cobalt | "in 24 hours" | Same day or within 24 hours |
| Intruder | "Same day pentest reports" | Same day or within 24 hours |
| Aikido | "Same-day results" | Same day or within 24 hours |
| Strike | "within the first 24 hours" | Same day or within 24 hours |
| Hadrian | "within 24 to 48 hours" | 24 to 48 hours |
| RunSybil | "same-day" for smaller applications; "up to 24 hours" for large ones | Same day or within 24 hours |
| Terra Security | "initial baseline results in 1–2 weeks" | Longer than 48 hours |
Source: the checked provider pricing or service pages, read October 8, 2026. "AI-run" means the provider sells the test as run, led or powered by AI. The statements mix first reports, initial results and completed tests, so they are not a uniform final-report measure. Bugcrowd says "in hours" without a number and is not counted. Synack Sara gives a 4–5-day assessment window, not a result-delivery deadline, and is also excluded.
How many penetration testing companies are there?
CREST's directory lists 516 company profiles under penetration testing. The U.S. government's GSA directory lists 609 penetration-testing contracts covering 591 distinct contractor names (both checked October 8, 2026). The lists overlap and do not give a global count. CREST is an industry body that vets testing companies.
In-house or outside testers?
Most security operations teams in a SANS survey use outside testers at least some of the time: 41% of the teams outsource penetration testing, 29% do it in-house and 27% do both (SANS, 2026 SOC Survey). 34% of organizations rely entirely on outside testers (Fortra, 2024).
How do these numbers connect to real breaches?
In 31% of breaches with a known entry route, excluding error and misuse, the attacker used a weak spot in software, called a vulnerability. That's up from 20% a year earlier (Verizon, 2026 Data Breach Investigations Report). 48,244 new vulnerabilities were published in 2025, 20% more than in 2024.
| Statistic | Source | Period |
|---|---|---|
| In 31% of breaches with a known entry route, excluding error and misuse, attackers got in by exploiting a vulnerability. That is up from 20% a year earlier. | Verizon, 2026 Data Breach Investigations Report | incidents November 2024 to October 2025 |
| Exploits were the most common way in for the sixth year in a row, behind 32% of the intrusions Mandiant investigated in 2025. | Mandiant (Google Cloud), M-Trends 2026 | 2025 |
| 48,244 new vulnerabilities (CVE records) were published in 2025, 20% more than the 40,077 published in 2024. | CVE Program, Metrics: Published CVE Records | 2025 |
| The U.S. government's list of vulnerabilities known to be used in attacks held 1,739 entries on October 8, 2026. 245 were added in 2025. | U.S. Cybersecurity and Infrastructure Security Agency, Known Exploited Vulnerabilities Catalog | as of October 8, 2026 |
| It took organizations an average of 247 days to find and contain a data breach. | IBM and Ponemon Institute, Cost of a Data Breach Report 2026 | breaches March 2025 to February 2026 |
| In breaches with a known entry route, excluding error and misuse, stolen or misused logins were the way in for 13% and phishing for 16%, against 31% for exploited vulnerabilities. | Verizon, 2026 Data Breach Investigations Report | incidents November 2024 to October 2025 |
Sources: as listed in each row, read October 8, 2026. The CISA list changes daily.
This is why fix times matter. A pentest looks for weak spots before attackers do, and the breach numbers show attackers going after software weak spots more often.
Which popular penetration testing statistics are wrong or out of date?
We checked 12 widely repeated penetration testing claims: 5 were misquoted, 4 were outdated as current claims, 2 had no primary source we could find, and 1 was an average of ten unnamed sources. Historic numbers can still be used with their year and original meaning. The table shows what each source really says and what to cite instead.
| # | The popular number | Where it started | Verdict | Cite this instead |
|---|---|---|---|---|
| 1 | "72% rely solely on open-source tools, while 50% use commercial tools." | Core Security, 2020 Penetration Testing Report | Misquoted | Fortra 2024 Penetration Testing Report: 33% use only free or open-source tools and 28% use no pen testing tools at all. |
| 2 | "75% of companies run penetration tests for compliance." | Core Security, 2022 Penetration Testing Report | Out of date | Fortra 2024 Penetration Testing Report: 72% say pen testing helps them meet and prove compliance with outside regulations or mandates (the question was reworded). |
| 3 | "85% of organizations increased their penetration testing budgets." | Pentera, State of Pentesting 2023 survey | Out of date | Pentera State of Pentesting 2025: 50% of U.S. enterprises expected to raise their 2025 pentest budget and 13% expected cuts. Omdia for Cobalt (2026): 88% plan to raise offensive security spending. |
| 4 | "1 in 3 companies say budget is why they don't test more." | Pentera, State of Pentesting 2023 survey | Out of date | Pentera State of Pentesting 2025 reports 44% of US CISOs naming budget, up from 24%. |
| 5 | "73% of successful breaches came through web applications." | Kaspersky Lab press release, August 16, 2018 | Misquoted | Verizon 2026 Data Breach Investigations Report: in 31% of breaches with a known entry route, excluding error and misuse, the attacker exploited a vulnerability. |
| 6 | "BLS projects 35% job growth for information security analysts, including penetration testers." | U.S. Bureau of Labor Statistics, Occupational Outlook Handbook, 2022 edition (archived copy of October 28, 2022) | Out of date | BLS (August 2026): information security analysts 21% growth, 2025 to 2035. "Computer occupations, all other", the group that holds penetration testers: 5%. |
| 7 | "The average penetration test costs $18,300." | eSecurity Planet, June 20, 2023 (updated December 7, 2023) | Weak method | Published prices on providers' own sites (this page, October 8, 2026), federal ceiling rates (GSA), or Pentera's yearly budget survey. |
| 8 | "Every $1 spent on penetration testing saves up to $10 in breach costs." | No original source found | No source found | IBM Cost of a Data Breach Report 2026: breaches at organizations that use offensive security testing cost $211,339 less than the $4.99 million average. That is a link in survey data, not proof of cause. |
| 9 | "More than 70% of organizations have adopted PTaaS, with another 14% planning to." | No original source found | No source found | Omdia for Cobalt (published June 2026, fielded May 2026; 400 North American respondents): "58% already utilize PTaaS". |
| 10 | "Web application testing is 36% of all penetration tests." | Mordor Intelligence market report, 2025 edition (archived copy of November 15, 2025) | Misquoted | Mordor's 36% was a share of estimated spending in 2024, not a share of tests. Its current edition puts network assessments at 38.23% of estimated spending in 2025. |
| 11 | "The penetration testing market will grow more than 24% through 2026." | Mordor Intelligence market report, an older edition (archived copy of March 16, 2023) | Misquoted | Mordor Intelligence now says 15.29% a year for 2026 to 2031. Across 19 firms the middle forecast is 15.3% a year (this page). |
| 12 | "32% of organizations run penetration tests annually or bi-annually, and 51% outsource them." | Core Security, 2020 Penetration Testing Report | Misquoted | Fortra 2024 Penetration Testing Report: 43% test one to two times a year; 34% rely entirely on third parties. |
Source: The PenTest Index source check, October 8, 2026. We traced ten claims to source content and found no primary support for two. Where the source page has changed, the download links an archived copy.
Jobs numbers need the same care. The 35% job-growth figure on many pages is from an old BLS edition. BLS now projects 21% growth for information security analysts from 2025 to 2035, and it doesn't count penetration testers in that group.
All 100 penetration testing statistics in one table
Every statistic on this page, with its source and period. Each row has its own link: add the row's anchor to the page address, for example #market-2025.
| # | Topic | Statistic | Source | Period |
|---|---|---|---|---|
| 1 | Market size | The median of 19 research firms' published estimates puts the global penetration testing market at about $2.40 billion in 2025. | The PenTest Index, Market size review (see pentest-market-size-estimates-2026.csv) | 2025 |
| 2 | Market size | Research firms put the 2025 penetration testing market anywhere from $1.98 billion (MarketsandMarkets) to $3.36 billion (Data Bridge Market Research). The highest estimate is 1.7 times the lowest. | The PenTest Index, Market size review | 2025 |
| 3 | Market size | For 2026, the middle estimate is $2.80 billion among the 8 included research firms that publish a 2026 figure. Their estimates run from $2.42 billion to $3.14 billion. | The PenTest Index, Market size review | 2026 |
| 4 | Market size | Forecast growth for the penetration testing market runs from 11.6% to 20.0% a year depending on the firm. The middle forecast is 15.3% a year. | The PenTest Index, Market size review | forecast periods ending 2030 to 2035 |
| 5 | Market size | At the middle forecast of 15.3% a year, the penetration testing market would double in about five years. | The PenTest Index, Market size review | from 2025 |
| 6 | Market size | Long-range forecasts for the penetration testing market run from $4.39 billion by 2031 (MarketsandMarkets) to $14.44 billion by 2033 (Data Bridge Market Research). | The PenTest Index, Market size review | 2031 to 2033 |
| 7 | Market size | Estimates of the 2026 market for penetration testing as a service (PTaaS) run from $165 million to $2.81 billion across 6 research firms. The highest is 17 times the lowest. | The PenTest Index, Market size review | 2026 |
| 8 | Market size | 6 of the 19 research firm pages show conflicting figures for the same thing on the same page. | The PenTest Index, Market size review | read October 2026 |
| 9 | Who tests | 13% of UK businesses carried out penetration testing in the 12 months before the survey. | UK Department for Science, Innovation and Technology and Home Office, Cyber Security Breaches Survey 2025/2026 (Figure 3.1) | fieldwork August to December 2025 |
| 10 | Who tests | By size, 10% of UK micro businesses, 21% of small, 38% of medium and 60% of large businesses carried out penetration testing in the past 12 months. | UK Department for Science, Innovation and Technology and Home Office, Cyber Security Breaches Survey 2025/2026 (data tables, Table 12) | fieldwork August to December 2025 |
| 11 | Who tests | Large UK businesses are six times as likely as micro businesses to run a penetration test (60% against 10%). | The PenTest Index, Calculation from Cyber Security Breaches Survey 2025/2026 | fieldwork August to December 2025 |
| 12 | Who tests | 7% of UK charities carried out penetration testing in the past 12 months. | UK Department for Science, Innovation and Technology and Home Office, Cyber Security Breaches Survey 2025/2026 (Figure 3.1) | fieldwork August to December 2025 |
| 13 | Who tests | The share of UK businesses running penetration tests was 12% in the survey published in April 2025 and 13% in the one published in April 2026. | UK Department for Science, Innovation and Technology and Home Office, Cyber Security Breaches Survey 2025 and 2025/2026 | 2025 and 2025/2026 editions |
| 14 | Who tests | 18% of UK businesses carried out a cyber security vulnerability audit in the past 12 months, against 13% for penetration testing. | UK Department for Science, Innovation and Technology and Home Office, Cyber Security Breaches Survey 2025/2026 (Figure 3.1) | fieldwork August to December 2025 |
| 15 | Who tests | 34.6% of EU businesses with 10 or more staff ran ICT security tests in 2024. That group includes penetration tests, but also tests of alert systems, security reviews and backup tests. | Eurostat, Security policy, measures, risks and staff awareness by size class of enterprise (isoc_cisce_ra) | 2024 |
| 16 | Who tests | In the EU, 29.8% of small businesses (10 to 49 staff), 54.1% of medium (50 to 249) and 78.1% of large businesses (250+) ran ICT security tests in 2024. | Eurostat, isoc_cisce_ra | 2024 |
| 17 | Who tests | Among EU countries, the share of businesses with 10 or more staff that ran ICT security tests in 2024 went from 18.2% in Hungary to 53.4% in the Netherlands. | The PenTest Index, Calculation from Eurostat isoc_cisce_ra (see eurostat-ict-security-tests-by-country-2024.csv) | 2024 |
| 18 | Who tests | The EU share has barely moved: 35.2% of businesses with 10 or more staff ran ICT security tests in 2019, 34.6% in 2022 and 34.6% in 2024. | Eurostat, isoc_cisce_ra | 2019, 2022, 2024 |
| 19 | Who tests | In Canada, 45% of large businesses (250 or more staff) hired an outside party to run a penetration test in 2017. | Statistics Canada, Cyber security and cybercrime challenges of Canadian businesses, 2017 (Juristat, released March 28, 2019) | 2017 |
| 20 | Who tests | Among the EU's four largest economies, 42.5% of German businesses with 10 or more staff ran ICT security tests in 2024, against 31.8% in Italy, 30.7% in Spain and 26.5% in France. | Eurostat, isoc_cisce_ra | 2024 |
| 21 | How often | In Fortra's 2024 survey of security professionals, 43% said their organization pen tests one to two times a year, 11% quarterly, 12% monthly, 17% weekly or daily, and 17% never. | Fortra (Core Security), 2024 Penetration Testing Report | 2024 edition |
| 22 | How often | Among 450 security professionals at mid-size and large organizations, 1% said they pentest every two years, 27% annually, 15% twice a year, 30% quarterly, 18% monthly and 8% continuously. | Cobalt, State of Pentesting Report 2025 (Figure 5) | 2025 edition |
| 23 | How often | 96% of large U.S. enterprises change their IT environment at least every quarter, but only 30% pentest that often. | Pentera, The State of Pentesting 2025 | fielded January 2025 |
| 24 | How often | In a survey of 200 U.S. security staff who oversee AI security spending, respondents said their enterprises test only 32% of their attack surface on average, even though 95% call pentesting a top or high priority. | Synack and Omdia, The 2026 State of Agentic AI in Pentesting | fielded December 11–22, 2025 |
| 25 | How often | 72% of security professionals in Fortra's 2024 survey said they feel pen testing has prevented a breach at their organization. That is what they believe, not a measured result. | Fortra (Core Security), 2024 Penetration Testing Report (Figure 2) | 2024 edition |
| 26 | How often | 72% of security professionals say pen testing helps them meet and prove compliance with outside regulations or mandates. | Fortra (Core Security), 2024 Penetration Testing Report (Figure 1) | 2024 edition |
| 27 | How often | 53% of organizations in Cobalt's 2026 survey run pentesting as an ongoing program, more than the 40% that test mainly for compliance. | Cobalt, State of Pentesting Report 2026 | 2026 edition |
| 28 | How often | 61% of security professionals in Cobalt's 2026 survey say customers ask for third-party pentest reports to check software security. Only compliance certifications are asked for more often. | Cobalt, State of Pentesting Report 2026 | 2026 edition |
| 29 | How often | 16 of the 43 penetration testing providers we checked publish a human-test time or a testing-day allowance on the checked pricing or service pages. Stated test times range from 1 day to several weeks; one provider adds "sometimes even months." | The PenTest Index, Published price check (timing columns; see pentest-published-price-check-2026-10-08.csv) | checked October 8, 2026 |
| 30 | Rules | 8 of the 21 entries in The PenTest Index rule tracker are in the group that requires testing; CMMC Level 3 is listed separately because its contracting rollout is suspended. | The PenTest Index, Penetration test rule tracker (see pentest-rule-tracker-2026.csv) | read October 8, 2026 |
| 31 | Rules | Of the 8 entries in the group that requires testing, 5 set an annual baseline, 2 set a three-year baseline and 1 leaves the timing to the organization. The listed exceptions still apply. | The PenTest Index, Penetration test rule tracker | read October 8, 2026 |
| 32 | Rules | 8 of the 21 tracker entries mention penetration testing or give guidance, 4 do not name it, and 1 has a suspended rollout. | The PenTest Index, Penetration test rule tracker | read October 8, 2026 |
| 33 | Rules | SOC 2, ISO/IEC 27001, the HIPAA Security Rule and CMMC Level 2 do not require a penetration test in their own text. | The PenTest Index, Penetration test rule tracker | read October 8, 2026 |
| 34 | Rules | PCI DSS v4.0.1 Requirements 11.4.2 and 11.4.3 require internal and external penetration tests at least once every 12 months and after any significant infrastructure or application upgrade or change. | PCI Security Standards Council, Prioritized Approach for PCI DSS v4.0.1 | v4.0.1 (in force) |
| 35 | Rules | For nonexempt institutions without effective continuous monitoring or another system that continually detects changes that may create vulnerabilities, the FTC Safeguards Rule requires annual penetration testing and vulnerability assessments at least every six months. | U.S. Federal Trade Commission, Standards for Safeguarding Customer Information | eCFR text current through October 7, 2026; checked October 8 |
| 36 | Rules | NYDFS Part 500 requires nonexempt covered entities to test from inside and outside their information systems at least annually, using a qualified internal or external party. | New York State Department of Financial Services, Cybersecurity Requirements for Financial Services Companies | amended November 1, 2023 |
| 37 | Rules | A proposed update to the HIPAA Security Rule would require a penetration test at least once every 12 months. It was proposed on January 6, 2025 and was still not final on October 8, 2026. | U.S. Department of Health and Human Services, HIPAA Security Rule To Strengthen the Cybersecurity of Electronic Protected Health Information (90 FR 898) | proposed January 6, 2025 |
| 38 | Rules | DORA sets a three-year baseline for threat-led penetration testing by designated financial firms; the regulator may increase or reduce that frequency. The law has applied since January 17, 2025. | European Union, Digital Operational Resilience Act | in application since January 17, 2025 |
| 39 | Rules | FedRAMP legacy guidance requires a third-party penetration test at least every 12 months unless the authorizing body approves a documented exception. Its 2026 rules have separate transition dates. | FedRAMP (U.S. General Services Administration), FedRAMP Penetration Test Guidance | guidance version 3.0 (June 30, 2022) |
| 40 | Rules | CMMC Level 3 still has an annual penetration-testing clause, but its contracting rollout is suspended. CMMC Level 2 does not name penetration testing. | U.S. Department of Defense, Cybersecurity Maturity Model Certification Program; CMMC suspension memo | CFR and CMMC suspension checked October 8, 2026 |
| 41 | Rules | IRS Publication 1075 requires penetration testing every 3 years on systems that hold federal tax information. | U.S. Internal Revenue Service, Publication 1075 | Rev. 11-2021 (current) |
| 42 | What tests find | Cobalt's 2026 report draws on more than 16,500 pentests of nearly 3,000 organizations over five years. | Cobalt, State of Pentesting Report 2026 | a five-year period (years not stated) |
| 43 | What tests find | BreachLock's 2026 report covers 531,770 findings from 4,970 penetration tests across more than 60 industries. | BreachLock, 2026 Penetration Testing Intelligence Report | 2026 report |
| 44 | What tests find | Broken access control was the most common high and critical finding in web application tests, at 27%. | BreachLock, 2026 Penetration Testing Intelligence Report | 2026 report |
| 45 | What tests find | 37% of the 11,646 vulnerabilities Synack's testers found for clients in 2025 were critical or high severity. | Synack, 2026 State of Vulnerabilities | 2025 |
| 46 | What tests find | The share of findings rated critical or high was 43.1% in manufacturing, 40.0% in technology, 39.4% in government, 32.4% in retail and 31.4% in financial services. | Synack, 2026 State of Vulnerabilities | 2025 |
| 47 | What tests find | Cross-site scripting was the most frequently found vulnerability in Synack's 2025 data, with authorization and permission flaws a close second. | Synack, 2026 State of Vulnerabilities | 2025 |
| 48 | What tests find | 31.9% of vulnerabilities found in internet-facing web applications and APIs were critical or high severity. | Edgescan, 2026 Vulnerability Statistics Report | 2025 |
| 49 | What tests find | Across 143 risk and vulnerability assessments by CISA and the U.S. Coast Guard in fiscal 2023, valid accounts were the most successful initial-access technique, behind 41% of successful first break-ins. | U.S. Cybersecurity and Infrastructure Security Agency, Analysis: Fiscal Year 2023 Risk and Vulnerability Assessments | fiscal year 2023 |
| 50 | Time to fix | 62% of security professionals say a lack of resources to act on findings or fix them is a challenge for their pen testing program, the most common challenge named. | Fortra (Core Security), 2024 Penetration Testing Report (Figure 4) | 2024 edition |
| 51 | Time to fix | Four reports published in 2026 give serious-flaw repair or resolution benchmarks of 38 to 58 days. The six figures cover different findings and use different measures. | The PenTest Index, Comparison of four published datasets | mostly 2025 data, published 2026 |
| 52 | Time to fix | Those published repair and resolution benchmarks are about three to four times a two-week target, which three-quarters of respondents set in Cobalt's 2025 survey. | The PenTest Index, Calculation from the four datasets and Cobalt's 2025 survey | 2026 report benchmarks compared with a 2025 survey target |
| 53 | Time to fix | The median organization takes 39 days to resolve a high-risk finding, counting only the findings it resolves. The fastest tenth take 13 days or fewer; the slowest tenth take 131 days or more. | Cobalt, State of Pentesting Report 2026 (Figure 15) | a five-year period (years not stated) |
| 54 | Time to fix | At the median organization, half of high-risk findings are resolved within 45 days. The fastest tenth of organizations get there in 10 days; the slowest tenth take 249 days, 25 times longer. | Cobalt, State of Pentesting Report 2026 (Figure 18) | a five-year period (years not stated) |
| 55 | Time to fix | A typical organization resolves 86% of its high-risk penetration test findings, meaning it marks them resolved or accepts the risk. The lowest tenth resolve 31% or less; the top tenth 96% or more. | Cobalt, State of Pentesting Report 2026 (Figure 11) | a five-year period (years not stated) |
| 56 | Time to fix | Critical vulnerabilities took an average of 38 days to fix in 2025, down from 63 days in 2024. High-severity ones took 58 days, down from 100. | Synack, 2026 State of Vulnerabilities | 2025 |
| 57 | Time to fix | High and critical vulnerabilities took an average of 54.81 days to fix in applications and APIs, and 39 days in devices and networks. | Edgescan, 2026 Vulnerability Statistics Report | 2025 |
| 58 | Time to fix | In Verizon's vulnerability-management data, only 26% of known exploited vulnerabilities found in organizations had every instance patched, down from 38% a year earlier. The median of company median times to full repair was 43 days. | Verizon, 2026 Data Breach Investigations Report, Figures 12–14 (vulnerability-management data) | 2025 vulnerability-management data |
| 59 | Time to fix | In Cobalt's 2025 report, fewer than half of all penetration test findings (48%) were recorded as resolved, against 69% of the most serious ones. | Cobalt, State of Pentesting Report 2025 | ten years to 2024 |
| 60 | Time to fix | Three-quarters of organizations have a target to fix vulnerabilities within two weeks of finding them. | Cobalt, State of Pentesting Report 2025 | 2025 edition |
| 61 | Time to fix | In enterprises with 1,000 or more staff, 37% of the vulnerabilities found in a 12-month period are still open at the end of it. | Edgescan, 2026 Vulnerability Statistics Report | 2025 |
| 62 | Time to fix | Reports sent through HackerOne took an average of 62 days to resolve, down from 135 days two years earlier. | HackerOne, Security Research Report 2026 | July 2025 to June 2026 |
| 63 | Time to fix | Across 10 industries, the time it takes to resolve half of high-risk findings runs from 38 days in software to 98 days in entertainment. | Cobalt, State of Pentesting Report 2026 (Figure 19); State of Pentesting in the Software Industry (July 30, 2026) | a five-year period (years not stated) |
| 64 | Time to fix | Small companies resolve 81% of their serious findings, against 60% at large organizations, and take 27 days rather than 61. | Cobalt, State of Pentesting Report 2025 | ten years to 2024 |
| 65 | Cost | 28 of the 43 penetration testing providers we checked showed no price for a test on the checked current pricing or service pages. | The PenTest Index, Published price check (see pentest-published-price-check-2026-10-08.csv) | checked October 8, 2026 |
| 66 | Cost | 15 of the 43 penetration testing providers we checked showed a price for a test or a testing plan on a checked pricing or service page. | The PenTest Index, Published price check | checked October 8, 2026 |
| 67 | Cost | The two AI-run single-test references with an explicit U.S.-dollar currency are US$1,500 per asset and US$4,000 per web application. | The PenTest Index, Published price check (see pentest-published-offers-2026-10-08.csv) | checked October 8, 2026 |
| 68 | Cost | Published U.S.-dollar starting prices for one test not sold as AI-run range from US$3,000 to US$12,400 across 10 offers from two providers. | The PenTest Index, Published price check (see pentest-published-offers-2026-10-08.csv) | checked October 8, 2026 |
| 69 | Cost | The median GSA hourly ceiling rate is $157.53 across 417 records whose job titles contain both "penetration" and "tester." | The PenTest Index, Analysis of GSA CALC+ ceiling rates (see gsa-penetration-tester-ceiling-rates-2026-10-08.csv) | source snapshot 2026-10-09 02:00:03 UTC; checked October 8, 2026 in America/Denver |
| 70 | Cost | GSA ceiling rates in the penetration-tester title sample range from $57.34 to $320.56 an hour. The middle half fall between $126.80 and $196.87. | The PenTest Index, Analysis of GSA CALC+ ceiling rates | source snapshot 2026-10-09 02:00:03 UTC; checked October 8, 2026 in America/Denver |
| 71 | Cost | Median GSA ceiling rates in the title sample rise with required experience: $130.69 an hour for 0 to 2 years, $152.19 for 3 to 5, $181.22 for 6 to 9 and $195.60 for 10 or more. | The PenTest Index, Analysis of GSA CALC+ ceiling rates | source snapshot 2026-10-09 02:00:03 UTC; checked October 8, 2026 in America/Denver |
| 72 | Cost | Large U.S. enterprises spent an average of $187,000 on penetration testing in 2024, about 10.5% of their IT security budget. | Pentera, The State of Pentesting 2025 | 2024 budgets; fielded January 2025 |
| 73 | Cost | Large U.S. enterprises spent an average of about $300,000 on penetration testing in 2025 (a weighted average), about 12% of their security spending, not counting salaries. | Pentera, AI Security & Exposure Benchmark 2026 | 2025 spending; fielded December 2025 |
| 74 | Cost | The average data breach cost $4.99 million worldwide and $11.5 million in the United States, according to IBM's 2026 report. | IBM and Ponemon Institute, Cost of a Data Breach Report 2026 | breaches March 2025 to February 2026 |
| 75 | Cost | In IBM's 2026 study, offensive security testing was associated with breach costs $211,339 below the $4.99 million overall average. The category includes red teaming, penetration testing and vulnerability testing. | IBM and Ponemon Institute, Cost of a Data Breach Report 2026 | breaches March 2025 to February 2026 |
| 76 | Cost | 88% of North American security teams surveyed plan to spend more on offensive security in the next 12 months. | Omdia for Cobalt, Next-generation Offensive Security Strategies Give Defenders the AI Advantage | fielded May 2026 |
| 77 | Cost | About 8 in 10 respondents in Cobalt's 2026 survey say their offensive security budget grew in the past year: 33% saw significant growth and 50% a small increase. | Cobalt, State of Pentesting Report 2026 | 2026 edition |
| 78 | Cost | Nearly 70% of large U.S. enterprises plan to raise their penetration testing budget in 2026. Most planned increases are 1% to 10%. | Pentera, AI Security & Exposure Benchmark 2026 | plans for 2026; fielded December 2025 |
| 79 | Providers | CREST lists 516 company profiles in its Penetration Testing accreditation filter. | CREST, CREST supplier directory | directory read October 8, 2026 |
| 80 | Providers | GSA lists 609 penetration-testing contract entries covering 591 distinct contractor names. | U.S. General Services Administration, GSA eLibrary, SIN 54151HACS, Penetration Testing subgroup 5415 | listing read October 8, 2026 |
| 81 | Providers | In SANS's 2026 SOC survey, 41% of responding security operations teams outsource penetration testing, 29% do it in-house and 27% do both. | SANS Institute, 2026 SOC Survey | fielded 2026 |
| 82 | Providers | 34% of respondents in Fortra's 2024 survey say their organizations rely entirely on outside penetration testers. | Fortra (Core Security), 2024 Penetration Testing Report | 2024 edition |
| 83 | AI | 87.8% of security practitioners who use AI tools to generate findings say those findings need significant manual checking at least sometimes. | Pentest-Tools.com, The state of AI pentesting survey (June 2026) | fielded June 17-18, 2026 |
| 84 | AI | 32% of findings in tests of AI and LLM applications are high risk, against 12% across all penetration tests. | Cobalt, State of Pentesting Report 2026 (Figure 6) | a five-year period (years not stated) |
| 85 | AI | Only 38.4% of high-risk findings in AI and LLM applications are recorded as resolved, against 73.7% for web applications and 77.3% for APIs: a gap of 38.9 percentage points between APIs and AI apps. | Cobalt, State of Pentesting Report 2026 (Figure 7) | a five-year period (years not stated) |
| 86 | AI | Nine providers put a number on how fast an AI-run penetration test returns results. Seven of the nine say within 48 hours, and six of those say the same day or within 24 hours. | The PenTest Index, Published price check (timing columns; see pentest-published-price-check-2026-10-08.csv) | checked October 8, 2026 |
| 87 | AI | 87% of U.S. enterprises in Synack and Omdia's survey were planning, piloting or using agentic AI for penetration testing. Respondents oversaw AI security spending. | Synack and Omdia, The 2026 State of Agentic AI in Pentesting | fielded December 11–22, 2025 |
| 88 | AI | Only 9% of security teams would rely on AI-run penetration testing for all their needs. It was 29% in a different group surveyed a year earlier. | Cobalt, AI and Pentesting Pulse Report 2026 | 2026 |
| 89 | AI | 78% of security teams say automated testing tools have missed real problems. | Cobalt, AI and Pentesting Pulse Report 2026 | 2026 |
| 90 | AI | 19% of organizations say they had a security incident involving AI or LLM tools in the past year. | Cobalt, State of Pentesting Report 2026 | 2026 edition |
| 91 | AI | 58% of North American security teams surveyed already use penetration testing as a service (PTaaS). | Omdia for Cobalt, Next-generation Offensive Security Strategies Give Defenders the AI Advantage | fielded May 2026 |
| 92 | AI | 64% of respondents in Synack and Omdia's U.S. enterprise survey preferred AI agents to lead penetration tests with people overseeing them. | Synack and Omdia, The 2026 State of Agentic AI in Pentesting | fielded December 11–22, 2025 |
| 93 | Breaches | In 31% of breaches with a known entry route, excluding error and misuse, attackers got in by exploiting a vulnerability. That is up from 20% a year earlier. | Verizon, 2026 Data Breach Investigations Report | incidents November 2024 to October 2025 |
| 94 | Breaches | Exploits were the most common way in for the sixth year in a row, behind 32% of the intrusions Mandiant investigated in 2025. | Mandiant (Google Cloud), M-Trends 2026 | 2025 |
| 95 | Breaches | 48,244 new vulnerabilities (CVE records) were published in 2025, 20% more than the 40,077 published in 2024. | CVE Program, Metrics: Published CVE Records | 2025 |
| 96 | Breaches | The U.S. government's list of vulnerabilities known to be used in attacks held 1,739 entries on October 8, 2026. 245 were added in 2025. | U.S. Cybersecurity and Infrastructure Security Agency, Known Exploited Vulnerabilities Catalog | as of October 8, 2026 |
| 97 | Breaches | It took organizations an average of 247 days to find and contain a data breach. | IBM and Ponemon Institute, Cost of a Data Breach Report 2026 | breaches March 2025 to February 2026 |
| 98 | Breaches | In breaches with a known entry route, excluding error and misuse, stolen or misused logins were the way in for 13% and phishing for 16%, against 31% for exploited vulnerabilities. | Verizon, 2026 Data Breach Investigations Report | incidents November 2024 to October 2025 |
| 99 | Workforce | The U.S. government projects 21% job growth for information security analysts from 2025 to 2035. It does not count penetration testers in that group. | U.S. Bureau of Labor Statistics, Information Security Analysts | 2025 to 2035 |
| 100 | Source check | The PenTest Index checked 12 widely repeated penetration testing claims: 5 were misquoted, 4 were outdated as current claims, 2 had no primary source found and 1 used an average of ten unnamed sources. | The PenTest Index, Popular numbers, checked (see pentest-popular-numbers-checked-2026.csv) | checked October 8, 2026 |
Source: as stated in each row or in the linked source line.
Why this matters now
- Rules are moving. The HIPAA proposal with a yearly test is still pending, FedRAMP's new rules have transition dates starting in December 2026, and CMMC's rollout changed in July 2026. DORA has applied since January 2025.
- Attackers use software flaws more. Exploited vulnerabilities were the way in for 31% of breaches with a known entry route, excluding error and misuse, up from 20% a year earlier (Verizon, 2026).
- AI is on both sides. AI apps carry more serious findings and resolve fewer of them. The checked U.S.-dollar AI test references are US$1,500 per asset and US$4,000 per web application; the full table keeps other prices and currencies (October 2026).
- Prices are still mostly hidden. About two in three providers we checked (28 of 43) show no price on their pricing or service pages.
How we built this
We read every source ourselves on October 8, 2026. We didn't run a survey or test any systems. Our own work is the line-ups, the counts and the checks.
- Market: we checked 27 whole-market report pages or named publisher excerpts and 8 PTaaS pages or excerpts, then rechecked the recorded figures. The 2025 median uses 19 included firms; the 2026 median uses the 8 in that group with a 2026 value. We used each global summary figure and kept conflicting numbers visible. The middle estimate is the median, calculated from full-precision CSV values. Growth rates keep each firm's own forecast period. Scope labels are our summaries, not direct quotations.
- Who tests: we read the UK government reports and source data tables. We checked all 210 country-table cells (206 numbers and four missing values) against Eurostat's public data service (isoc_cisce_ra; E_SECMTST; NACE C10–S951 excluding K; percent of enterprises; four employee-size groups; 2019, 2022 and 2024). The source was updated June 15, 2026. Missing cells stay blank, and source flags are retained. The Canada figure remains explicitly historical.
- Rules: we checked 21 tracker entries against their texts, read the testing clauses with their scope and exemptions, and checked current versions and transition notices. Twenty entries were checked against issuer or regulator documents, including the PCI council's Prioritized Approach excerpt. The ISO-authored full standard was read through a public mirror; this site did not supply a licensed copy. We counted eight entries in the group that requires testing, eight in mentions or guidance, four with no named test, and CMMC Level 3 separately because its contracting rollout is suspended. Its annual clause remains in the CFR, and existing contracts may await a change. The proposed HIPAA row is outside the 21.
- Prices and timelines: we re-read the 43 chosen providers' cited pricing, service and other source pages in the final audit, then checked the amounts, scopes, required extras, currencies and time claims against the saved source text. We opened additional source pages to resolve dates, terms, price conflicts and start times. The download gives the exact checked URLs, including start-time sources. A missing price means we found none on those pages; it does not mean every page on the site was searched. General market ranges ("tests cost $5,000 to $150,000") were not counted as a provider's own price. The one-test summaries exclude subscriptions, unit-only prices, broad scope-based ranges, and Synack's fees that require a separately priced platform. The U.S.-dollar comparisons additionally require an explicit USD currency: 10 non-AI starting-price records and 2 AI-test references. The broader printed-dollar sets contain 30 non-AI and 4 AI references and are not a currency-normalized comparison. Vanta and Drata were outside this 43-provider sample.
- Federal rates: we queried GSA's public CALC+ data for "penetration" and kept all titles containing both "penetration" and "tester," ignoring case. That returned 417 records, including two software developer/tester titles. We kept the API's full price precision, calculated the median and inclusive quartiles, then rounded the displayed results to cents. The mean is $164.46. The download keeps contract IDs and the source timestamp so the count can be repeated.
- Company reports: each publisher's own report, landing page or press release. We note the sample and who paid. Where a full report sits behind a form, we used the publisher's own summary and say so in the download's
read_incolumn. - Popular numbers: we checked the 12 claims in the draft against cited or identifiable origins. Ten led to source content, including archived BLS and Mordor pages. For the $1-to-$10 and PTaaS 70%-plus-14% claims, we searched the exact wording and followed the cited publisher trails without finding an original supporting study. The CSV records what we found; no source found does not mean a claim has been proved false.
- Provider counts: we recorded the CREST penetration-testing directory facet and kept all 609 GSA penetration-testing contract listings. The GSA count represents 591 distinct contractor-name strings; we did not merge corporate groups or add the two directories.
- Charts and arithmetic: charts use the same CSV values as their tables. Subtractions, ratios, medians, inclusive quartiles and record counts are calculated before display rounding. The data zip includes a script that repeats our calculations from the CSVs.
- To repeat our work: every table is in the download with its source link and check date.
You can also read how The PenTest Index checks provider terms for its comparison.
What this data does and does not show
- Market sizes are models, not measurements.
- Company reports cover each company's own customers. Most surveys here were paid for by a company that sells the thing being measured.
- The official current "who tests" figures here are for the UK and the EU; Canada is a 2017 historical comparison. We found no official U.S. penetration-test participation figure in this audit. The EU measure covers more than pentests and excludes finance.
- The price check covers 43 providers we chose, on one day. A site may show a price or a timeline on a page we didn't read. "Starting at" prices aren't quotes.
- GSA ceiling rates are contract and labor-category prices, not salaries or final project quotes. Agencies can negotiate less; private prices differ. The title rule includes two software developer/tester records.
- The rule tracker reports each rule's text. It isn't legal advice.
- The fix-time reports use different measures and cover different kinds of flaws. Cobalt's "resolved" includes accepted risk, and "unresolved" includes findings nobody reported back on.
- The industry half-lives are Cobalt's modelled figures for its own customers, not a ranking of how safe whole industries are.
- Some figures are older than 2026. Each one shows its own year or period.
How to cite this page
The PenTest Index. "Penetration Testing Statistics 2026: ~$2.8B Market, 100 Stats" Updated October 8, 2026. https://thepentestindex.com/research/penetration-testing-statistics/
For one number, add its anchor, for example https://thepentestindex.com/research/penetration-testing-statistics/#market-2025. For a number we quote from another publisher, credit that publisher too. They did the measuring.
Reuse: you may reuse The PenTest Index's original calculations, chart designs and table compilation with credit by name to The PenTest Index. This permission does not cover third-party text, data, logos or other material. Keep each original source's credit and follow its terms. A link is not required.
Download the data
Ten CSV files, the calculation script and its results in one zip, no form and no sign-up: penetration-testing-statistics-2026.zip.
| File | What's in it | Rows |
|---|---|---|
| penetration-testing-statistics-2026.csv | All 100 statistics, with source, period, sample and anchor | 100 |
| pentest-market-size-estimates-2026.csv | 27 whole-market estimates and 8 PTaaS records, including excluded estimates and source conflicts | 35 |
| pentest-rule-tracker-2026.csv | 21 tracked rules plus 1 proposal, with source text, exceptions and rollout status | 22 |
| eurostat-ict-security-tests-by-country-2024.csv | Security-test shares for 35 countries and areas, with size groups and 2019–2024 values | 35 |
| pentest-published-price-check-2026-10-08.csv | 43 providers: observed price disclosure, human-test times, AI result times and start times | 43 |
| pentest-published-offers-2026-10-08.csv | All 54 priced offers, with required extras, currency and U.S.-dollar inclusion flags | 54 |
| gsa-penetration-tester-ceiling-rates-2026-10-08.csv | All 417 records matching the stated GSA title rule, at source precision | 417 |
| gsa-pentest-contractor-listings-2026-10-08.csv | 609 GSA contract listings used to count 591 distinct contractor names | 609 |
| pentest-popular-numbers-checked-2026.csv | 12 common claims checked against source content, including three archives | 12 |
| pentest-fix-time-and-closure-benchmarks-2026.csv | Repair times, resolution rates and industry benchmarks behind Tables 9–11 and 16 | 73 |
Source: as stated in each row or in the linked source line.
Every row carries its source and the date we checked it. reproduce.py repeats the original counts, medians, ratios and selected price ranges using these CSVs. calculation-results.json records the resulting values.
Questions people ask
How often should penetration testing be done?
Five of the eight entries in our group that requires testing set an annual baseline (21-entry tracker, October 2026). Scope and exceptions still apply. CMMC Level 3 is separate because its contracting rollout is suspended. PCI DSS also asks for a test after significant infrastructure or application changes. In Fortra's 2024 survey, 43% of respondents said their organization tests once or twice a year.
Is penetration testing a legal requirement?
Sometimes. Some laws and regulations require it, such as the FTC Safeguards Rule and New York's financial regulation, subject to exemptions. So does PCI DSS, the card industry's own standard. Eight of our 21 tracker entries are in the group that requires testing; CMMC Level 3 is separate because its contracting rollout is suspended. The scope and exceptions are in the rule table.
Is penetration testing required for SOC 2?
Not in the text. The SOC 2 criteria name penetration testing once, as an example of how a company can check its controls. The company's own controls or customer commitments can still call for a test.
How much does a penetration test cost?
Published U.S.-dollar starting prices for one test not sold as AI-run range from US$3,000 to US$12,400 across 10 offers from two providers. The two AI-run single-test references with an explicit U.S.-dollar currency are US$1,500 per asset and US$4,000 per web application. About two in three providers (28 of 43) showed no price on the current pricing or service pages we checked on October 8, 2026.
How long does a penetration test take?
Providers' own pages state 1 day to several weeks for a test done by people, and one adds "sometimes even months." 16 of the 43 providers we checked give a human-test time, coverage window or testing-day allowance. For web applications, three of the eight that give a number say one to two weeks. Of the 9 providers that put a number on AI-test results, 7 say within 48 hours; these claims include first or baseline results (checked October 8, 2026).
How big is the penetration testing market?
About $2.4 billion in 2025 and about $2.8 billion in 2026, the middle of research firms' estimates. The 2025 estimates run from $1.98 billion to $3.36 billion.
What percentage of companies do penetration testing?
13% of UK businesses reported a test in the 12 months before the August–December 2025 survey, and 60% of large ones did (UK government, 2025/2026). In the EU, 34.6% of businesses with 10 or more staff ran security tests of any kind in 2024. We found no official U.S. figure.
Does penetration testing prevent breaches?
These reports do not show that testing caused fewer breaches. 72% of security professionals in Fortra's 2024 survey feel pen testing has prevented a breach at their organization. IBM's 2026 report found breaches cost $211,339 less at organizations that use offensive security testing, but that's a link in survey data, not proof of cause.
Will AI replace penetration testers?
The surveys do not measure future job replacement. Only 9% of security teams would rely on AI-run testing for all their needs (Cobalt, 455 people). And 87.8% of practitioners who use AI tools to generate findings say those findings need significant manual checking at least sometimes (Pentest-Tools.com, June 2026).
What do penetration tests find most often?
In BreachLock's tests, broken access control was the most common serious web finding, at 27% of high and critical findings (2026 report). Cross-site scripting, a flaw that lets an attacker run code in someone else's browser, was the most frequent finding in Synack's 2025 data.
Which industry fixes pentest findings fastest?
Software, in Cobalt's data: half of high-risk findings are resolved within 38 days. Entertainment is slowest at 98 days. Healthcare and finance sit in the middle at 55 days each.
How many penetration testing companies are there?
As of October 8, 2026, CREST's directory lists 516 company profiles under penetration testing. GSA lists 609 penetration-testing contracts covering 591 distinct contractor names. These lists overlap and do not give a global company count.
Which country does the most security testing?
In the EU, the Netherlands: 53.4% of businesses with 10 or more staff ran security tests of any kind in 2024. Hungary is lowest in the EU at 18.2%. That measure is wider than penetration testing.
What is a penetration test?
A planned, permitted test that simulates an attack on systems you are allowed to assess, to find weak spots before criminals do.
Sources
All sources were read on October 8, 2026. The research firm pages, rule texts and provider pages are listed with links in their own download files.
- UK Department for Science, Innovation and Technology and Home Office. Cyber Security Breaches Survey 2025/2026 (Figure 3.1). Checked October 8, 2026.
- Eurostat. Security policy, measures, risks and staff awareness by size class of enterprise (isoc_cisce_ra). Checked October 8, 2026.
- Statistics Canada. Cyber security and cybercrime challenges of Canadian businesses, 2017 (Juristat, released March 28, 2019). Checked October 8, 2026.
- Fortra (Core Security). 2024 Penetration Testing Report. Checked October 8, 2026.
- Cobalt. State of Pentesting Report 2025 (Figure 5). Checked October 8, 2026.
- Pentera. The State of Pentesting 2025. Checked October 8, 2026.
- Synack and Omdia. The 2026 State of Agentic AI in Pentesting. Checked October 8, 2026.
- Cobalt. State of Pentesting Report 2026. Checked October 8, 2026.
- Cobalt. State of Pentesting Report 2026. Checked October 8, 2026.
- PCI Security Standards Council. Prioritized Approach for PCI DSS v4.0.1. Checked October 8, 2026.
- U.S. Federal Trade Commission. Standards for Safeguarding Customer Information. Checked October 8, 2026.
- New York State Department of Financial Services. Cybersecurity Requirements for Financial Services Companies. Checked October 8, 2026.
- U.S. Department of Health and Human Services. HIPAA Security Rule To Strengthen the Cybersecurity of Electronic Protected Health Information (90 FR 898). Checked October 8, 2026.
- European Union. Digital Operational Resilience Act. Checked October 8, 2026.
- FedRAMP (U.S. General Services Administration). FedRAMP Penetration Test Guidance. Checked October 8, 2026.
- U.S. Department of Defense. Cybersecurity Maturity Model Certification Program. Checked October 8, 2026.
- U.S. Internal Revenue Service. Publication 1075. Checked October 8, 2026.
- Cobalt. State of Pentesting Report 2026. Checked October 8, 2026.
- BreachLock. 2026 Penetration Testing Intelligence Report. Checked October 8, 2026.
- BreachLock. 2026 Penetration Testing Intelligence Report. Checked October 8, 2026.
- Synack. 2026 State of Vulnerabilities. Checked October 8, 2026.
- Edgescan. 2026 Vulnerability Statistics Report. Checked October 8, 2026.
- U.S. Cybersecurity and Infrastructure Security Agency. Analysis: Fiscal Year 2023 Risk and Vulnerability Assessments. Checked October 8, 2026.
- Verizon. 2026 Data Breach Investigations Report. Checked October 8, 2026.
- Cobalt. State of Pentesting Report 2025. Checked October 8, 2026.
- HackerOne. Security Research Report 2026. Checked October 8, 2026.
- Cobalt. State of Pentesting Report 2026 (Figure 19); State of Pentesting in the Software Industry (July 30, 2026). Checked October 8, 2026.
- The PenTest Index. Analysis of GSA CALC+ ceiling rates. Checked October 8, 2026.
- Pentera. AI Security & Exposure Benchmark 2026. Checked October 8, 2026.
- IBM and Ponemon Institute. Cost of a Data Breach Report 2026. Checked October 8, 2026.
- Omdia for Cobalt. Next-generation Offensive Security Strategies Give Defenders the AI Advantage. Checked October 8, 2026.
- Cobalt. State of Pentesting Report 2026. Checked October 8, 2026.
- CREST. CREST supplier directory. Checked October 8, 2026.
- U.S. General Services Administration. GSA eLibrary, SIN 54151HACS. Checked October 8, 2026.
- SANS Institute. 2026 SOC Survey. Checked October 8, 2026.
- Pentest-Tools.com. The state of AI pentesting survey (June 2026). Checked October 8, 2026.
- Cobalt. AI and Pentesting Pulse Report 2026. Checked October 8, 2026.
- Mandiant (Google Cloud). M-Trends 2026. Checked October 8, 2026.
- CVE Program. Metrics: Published CVE Records. Checked October 8, 2026.
- U.S. Cybersecurity and Infrastructure Security Agency. Known Exploited Vulnerabilities Catalog. Checked October 8, 2026.
- U.S. Bureau of Labor Statistics. Information Security Analysts. Checked October 8, 2026.
- UK Department for Science, Innovation and Technology and Home Office. Cyber Security Breaches Survey 2025/2026: technical report. Checked October 8, 2026.
- UK Department for Science, Innovation and Technology and Home Office. Cyber Security Breaches Survey 2025. Checked October 8, 2026.
- Pentera. 2024 State of Pentesting survey report. Checked October 8, 2026.
- Cobalt. State of Pentesting in the Healthcare Industry (August 18, 2026). Checked October 8, 2026.
- Cobalt. State of Pentesting in Financial Services and Insurance Industries (August 18, 2026). Checked October 8, 2026.
- PCI Security Standards Council. Just Published: PCI DSS v4.0.1. Checked October 8, 2026.
- Federal Register. DFARS: Assessing Contractor Implementation of Cybersecurity Requirements (90 FR 43560). Checked October 8, 2026.
- FedRAMP. 2026 timeline. Checked October 8, 2026.
- Fortune Business Insights. Penetration testing market report page. Checked October 8, 2026.
- Mordor Intelligence. Penetration testing market report page. Checked October 8, 2026.
- MarketsandMarkets. Penetration testing market report page. Checked October 8, 2026.
- Data Bridge Market Research. Penetration testing market report page. Checked October 8, 2026.
- Core Security. Core Security, 2020 Penetration Testing Report. Checked October 8, 2026.
- Core Security. Core Security, 2022 Penetration Testing Report. Checked October 8, 2026.
- Pentera. Pentera, State of Pentesting 2023 survey. Checked October 8, 2026.
- Kaspersky Lab press release. Kaspersky Lab press release, August 16, 2018. Checked October 8, 2026.
- eSecurity Planet. eSecurity Planet, June 20, 2023 (updated December 7, 2023). Checked October 8, 2026.