Research · Penetration testing
Penetration Testing Market Size: About $2.52 Billion in 2025, Across 38 Estimates
About $2.52 billion in 2025 is the median of 38 published estimates of the global penetration testing market, according to The PenTest Index's October 2026 comparison. The median is the middle value. Most estimates, 25 of 38, sit between $2.0 billion and $3.0 billion. A few run far higher, up to $11.59 billion. These are estimates, not measured sales. Leave out the seven flagged pages and the median is $2.50 billion. Here's each one and why they disagree. See the figures and sources.
Key penetration testing market statistics
- About $2.52 billion: the median of 38 published estimates of the global penetration testing market in 2025. The PenTest Index calculation and all 38 sources, October 9, 2026.
- $1.80 billion to $11.59 billion: the full range of those 38 estimates for 2025. 25 of the 38 fall between $2.0 billion and $3.0 billion. The PenTest Index calculation and sources, October 9, 2026.
- $2.91 billion: the median of 17 published estimates of the penetration testing market in 2026. They range from $2.30 billion to $5.90 billion. The PenTest Index calculation and sources, October 9, 2026.
- About 14.5% a year: the median forecast growth rate across the 38 report pages. 27 stated rates fall between 13% and 17%; one more is stated only as “over 16.4%.” Calculation and source limits.
- About $8.7 billion: the median of 12 published forecasts for the penetration testing market in 2034. 11 of the 12 fall between $6.99 billion and $10.46 billion. The PenTest Index calculation and sources, October 9, 2026.
- 56% lower: in March 2020, MarketsandMarkets forecast a $4.5 billion penetration testing market by 2025. Its March 2026 report puts 2025 at $1.98 billion. Both editions and the calculation.
- About 38%: North America's estimated share of 2025 penetration testing spending: the median of 17 report pages is 37.5%, with a range of 32% to about 43%. The PenTest Index calculation and sources, October 9, 2026.
- $600 million to $801 million: two publishers’ estimates of the 2025 U.S. penetration testing market: Dimension Market Research ($600 million, a 2025 projection) and Precedence Research ($800.85 million). Report pages and scope, checked October 9, 2026.
- 8 of 10: report pages with a clear 2025 industry leader put banking and finance first. The PenTest Index classification and sources, October 9, 2026; includes labelled 2025 projections.
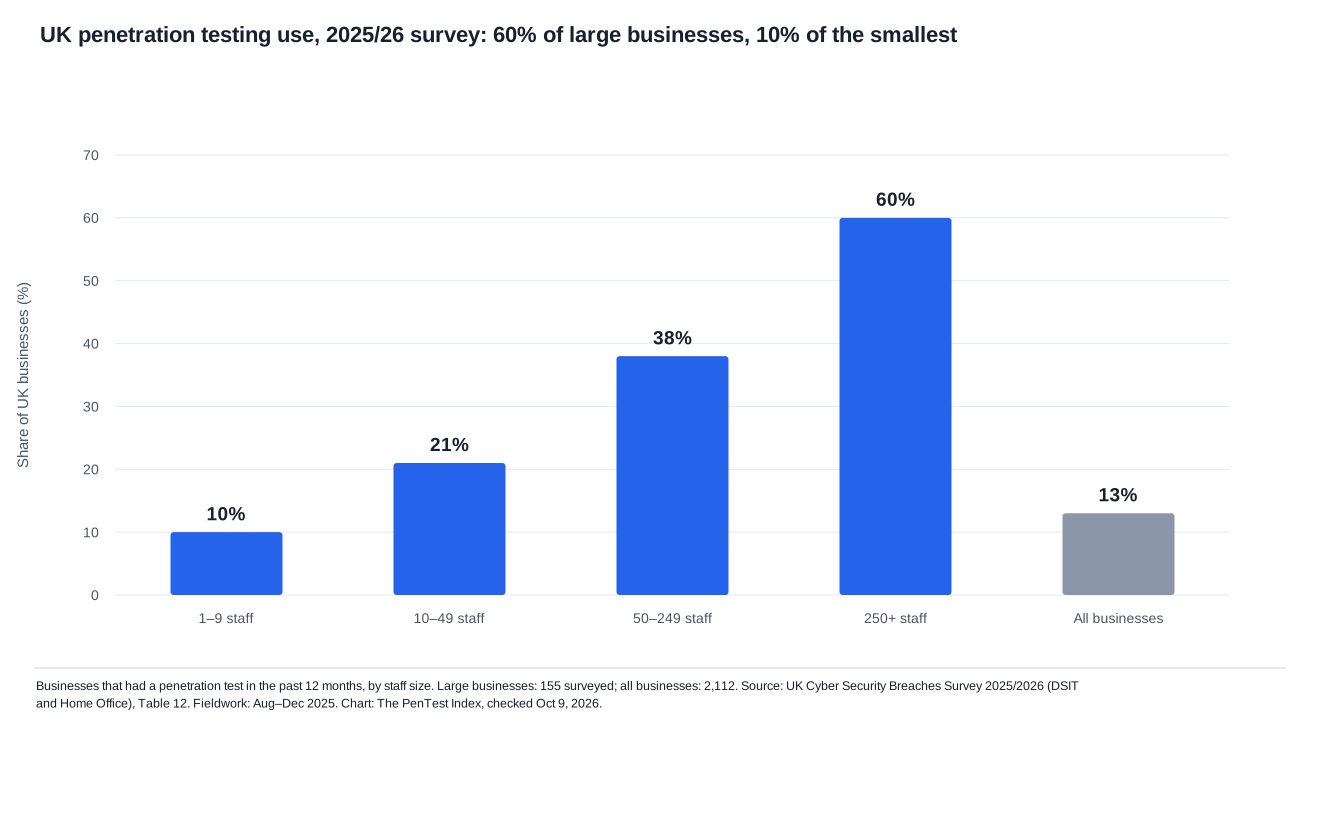
- 13%: UK businesses that had a penetration test in the past 12 months: 10% of businesses with 1 to 9 staff and 60% of those with 250 or more. UK Cyber Security Breaches Survey 2025/2026 and data tables, published April 30, 2026; fieldwork August–December 2025.
- About 1.2%: the ratio of the median penetration testing estimate ($2.52 billion) to Gartner's July 2025 forecast of $213.025 billion in total 2025 information security spending. This is a scale comparison, not a measured market share. Sources and arithmetic.
- $0.72 billion to $2.81 billion: four research firms' estimates of the 2026 penetration testing as a service (PTaaS) market. The highest is 3.9 times the lowest. Publisher figures, checked October 9, 2026.
- $771.5 million: eight funding announcements of $40 million or more by six automated or AI pen testing companies, January 2025 to October 9, 2026. The PenTest Index count and original announcements; includes the total funding Novee disclosed at launch.
- “Well over $200 million”: the revenue NetSPI and Synack gave for their combined company, with no period stated. The merger closed October 5, 2026. NetSPI’s September 2 release and Synack’s completion notice.
A flagged page (marked †) is one we would not cite on its own. The tracker says why for each.
How big is the penetration testing market?
Published estimates put the global penetration testing market at about $2.52 billion in 2025. That is the median of 38 estimates from research firms. 25 of the 38 fall between $2.0 billion and $3.0 billion, and the full range is $1.80 billion to $11.59 billion. These are models built by research firms, not measured sales.
A penetration test, or pen test, is a planned and permitted attack on your own systems. NIST, the U.S. standards agency, calls it "security testing in which evaluators mimic real-world attacks in an attempt to identify ways to circumvent the security features of an application, system, or network" (NIST SP 800-115 glossary entry). The market is what the world spends on those tests, and on the tools used to run them.
Here's how the median works. Line the 38 numbers up from smallest to biggest. The two in the middle, the 19th and 20th, are $2.50 billion and $2.54 billion. Halfway between them is $2.52 billion. Nineteen pages say less than that, and nineteen say more.
| # | Publisher | 2025 | 2026 | Forecast | Yearly growth (stated) | Page date | Check before citing |
|---|---|---|---|---|---|---|---|
| 1 | Verified Market Research (Pen-testing Market report) † | $1.80B | — | 2033: $2.66B | 5% | Jul 2026 | A second report from this firm. Its main report gives no 2025 value and says $2.45B for 2024. The page's meta description ties $1.8B to 2024. |
| 2 | Vyansa Intelligence | $1.89B | $2.30B | 2032: $5.04B | 15.04% | Not shown | No date on the page. Its 2026 figure is 21.7% above its 2025 figure, against a stated 15.04% a year. |
| 3 | MarketsandMarkets | $1.98B | — | 2031: $4.39B | 14.2% | Mar 2026 | Its separate U.S. page shows nearly the same dollars as this global page ($1.98B for 2025; $4.38B for 2031). |
| 4 | Dimension Market Research | $2.00B | — | 2034: $8.70B | 17.7% | Aug 2025 | Says the market will 'grow by USD 6.4 billion', but its own figures differ by $6.7B. |
| 5 | DataM Intelligence | $2.09B | — | 2033: $7.08B | 16.3% | Apr 23, 2026 | — |
| 6 | Research Nester | $2.11B | $2.42B | 2035: Over $9.63B | Over 16.4% | Mar 12, 2026 | Forecast printed as 'exceed USD 9.63 billion' and growth as 'over 16.4%'. |
| 7 | P&S Intelligence | $2.11B | — | 2030: $4.71B | 17.2% | Not shown | Main sentence is for 2024 (USD 1,818.2 million); the 2025 figure is in the page's summary table. No date on the page. |
| 8 | Reports Insights | $2.15B | — | 2033: $6.04B | 13.8% | Aug 1, 2025 | — |
| 9 | SkyQuest | $2.19B | — | 2033: $7.74B | 17.1% | Nov 2025 | Opening gives $7.74B for 2033 and 17.1% growth; FAQ gives $7.77B and 17.12%. An undated snapshot also shows $2.01B and 15.8%, without a clear base year. |
| 10 | Future Market Insights † | $2.20B | — | 2035: $8.40B | 14.4% | Sep 9, 2025 | Three different 2025 values on one page ($2.2B headline; $1,913.6M scope table; $1,676.6M history section) and two 2035 values ($8.4B and $7,363.3M). |
| 11 | Growth Market Reports | $2.24B | — | 2034: $6.99B | 13.7% | Jun 2026 | Says it is a product of DataIntelo Solutions LLP, as does Market Intelo ($2.80B). |
| 12 | IndustryARC | $2.34B | — | 2032: $6.03B | 14.5% | Not shown | No date on the page. A second set of figures is still on it ($4.6B by 2030 in the scope table, by 2032 in the FAQ). |
| 13 | Mordor Intelligence | $2.36B | $2.72B | 2031: $5.54B | 15.29% | Sep 11, 2026 | — |
| 14 | Market Data Forecast | $2.38B | $2.71B | 2034: $7.56B | 13.7% | Oct 2026 | Names both Asia Pacific and North America as the fastest-growing region in different places. |
| 15 | Straits Research | $2.40B | $2.77B | 2034: $8.63B | 15.28% | Aug 24, 2026 | Opening and FAQ give North America 37.5% for 2025; other passages give 35% and 39% without a matching year. |
| 16 | Polaris Market Research | $2.44B | $2.84B | 2034: $9.58B | 16.4% | Oct 9, 2026 (updated; as printed) | — |
| 17 | Dataintelo | $2.47B | — | 2034: $7.72B | 13.5% | Oct 5, 2026 | Its services-only page says $2.3B for 2024. |
| 18 | Emergen Research † | $2.48B | — | 2035: $9.42B | 14.6% | Aug 4, 2026 (modified) | FAQ on the same page says $2.84B for 2025 and 14.8% a year. |
| 19 | Verified Market Reports | $2.50B (middle) | — | 2032: $5.90B | 13.05% | May 31, 2026 | Same firm's second page says '5.6 billion' with no currency (set aside). |
| 20 | Market Research Future | $2.54B (middle) | $2.91B | 2035: $9.62B | 14.2% | Sep 15, 2026 | Its six 2025 shares are each about 0.925 times those on Mordor's page. Names WantStats as parent, as does WiseGuy Reports. |
| 21 | The Insight Partners | $2.54B | — | 2034: $9.80B | 16.21% | Apr 28, 2026 | Also prints a total addressable market of about US$52.18B during 2026–2034; that is not a single-year market-size estimate. |
| 22 | Fortune Business Insights | $2.74B | $3.09B | 2034: $7.41B | 11.6% | Sep 21, 2026 | Two North America shares for 2025 (35.10% and 39.70%); its regional values add to $3.39B, not $2.74B. |
| 23 | Market Intelo | $2.80B | $3.20B | 2034: $7.90B | 13.7% | Jun 11, 2026 | Status label says 'Upcoming'; the 2026 figure appears only in the chart data; puts Asia Pacific first. Says it is a product of DataIntelo Solutions LLP, as does Growth Market Reports ($2.24B). Its $2.80B for 2025 and $7.90B for 2034 imply about 12.2% yearly, rather than the stated 13.7%. |
| 24 | Precedence Research | $2.81B | $3.14B | 2035: About $8.51B | 11.72% | Sep 23, 2026 | Forecast printed as 'about' $8.51B. |
| 25 | TrendX Insights | $2.87B | $3.10B | 2034: $8.76B | 13.2% | May 2026 | 2026 value appears only in a rounded snapshot table, which shows 2025 as 2.90. |
| 26 | Value Market Research | $2.88B | $3.32B | 2034: $10.46B | 15.41% | Sep 24, 2026 | Its six 2025 shares are each 1.14 to 1.25 points above those on Mordor's page. |
| 27 | Reportprime † | $2.89B | — | 2031: $5.92B | 13.2% | Jul 2026 | Top of the page: $2.55B for 2024, $2.89B for 2025, $5.92B by 2031. Overview, scope table and FAQ shift each figure one year later. |
| 28 | Maximize Market Research | $3.00B | — | 2032: Nearly $8.74B | 16.5% | May 18, 2026 | A callout labels the 2025 figure 'Forecast'. Forecast printed as 'nearly' $8.74B. |
| 29 | WiseGuy Reports † | $3.15B | — | 2035: $8.00B | 9.8% | Aug 2026 | FAQ gives the 2025 figure for 2024. Names WantStats as parent, as does Market Research Future. |
| 30 | Data Bridge Market Research | $3.36B | — | 2033: $14.44B | 20% | May 12, 2026 | Page meta tags print the growth rate as 2.00%; body says 20.00%. |
| 31 | BrandEssence Market Research | $3.38B | — | 2032: $9.54B | 15.97% | Dec 2025 | — |
| 32 | Market Growth Reports | $3.67B | $4.46B | 2035: $25.36B | 21.4% | Sep 9, 2026 | The 2025 value is in the FAQ. Opening and scope table give $4,456.08M for 2026 and $25,357.81M for 2035; 21.4% CAGR for 2026–2035. |
| 33 | Vantage Market Research | $3.90B | — | 2035: $14.80B | 14.3% | Jun 2026 | — |
| 34 | Spherical Insights (blog article) † | $3.96B | — | 2035: $14.28B | 13.69% | Jul 2026 | From the firm's own blog article, rather than a report landing page. |
| 35 | Global Growth Insights † | $4.18B | $4.73B | 2034: $12.67B | 13.1% | Sep 16, 2025 | Titled 'Cyber Security Penetration Testing Market'; last updated Sep 2025, so its 2025 figure is a projection. Its 36% North America share has no explicit year and is excluded from the dated regional subset. Industry shares total 107% and industry dollar values total $4.47B against its $4.18B headline; no industry leader is counted. |
| 36 | Market Research Intellect | About $5.15B | $5.90B | 2035: $19.96B | 14.5% | May 31, 2025 | 2025 value is approximately $5.15B. Last updated May 2025, before the year ended. A second passage says $4.5B for 2024 and $11.7B by 2033. |
| 37 | TechSci Research | $7.19B | — | 2031: $17.86B | 16.37% | May 2026 | Far above most other pages; the page shows a published date and also calls the report 'upcoming'. |
| 38 | Exactitude Consultancy | $11.59B | — | 2035: $28.21B | 9.3% | Aug 27, 2026 | Far above every other page. Summary rounds the 2035 forecast to $28.20B; detailed text prints $28,213.4M. Network share is 35% and 46.7% in different places; both North America and Asia Pacific are called fastest-growing. |
Source: each publisher's report page, linked in the table, checked October 9, 2026. Values are in US$ billions, rounded here to two decimals; the CSV keeps the source precision and qualifiers. Median, flags and arithmetic: The PenTest Index. † = flagged page. Page dates are the ones each page shows.
Hollow dot (†) = flagged page; see the table for why. Median of 38 = average of the 19th and 20th values ($2.50B and $2.54B) = $2.52B. Source: The PenTest Index analysis of 38 publisher pages, checked Oct 9, 2026. thepentestindex.com
Download PNGDownload SVG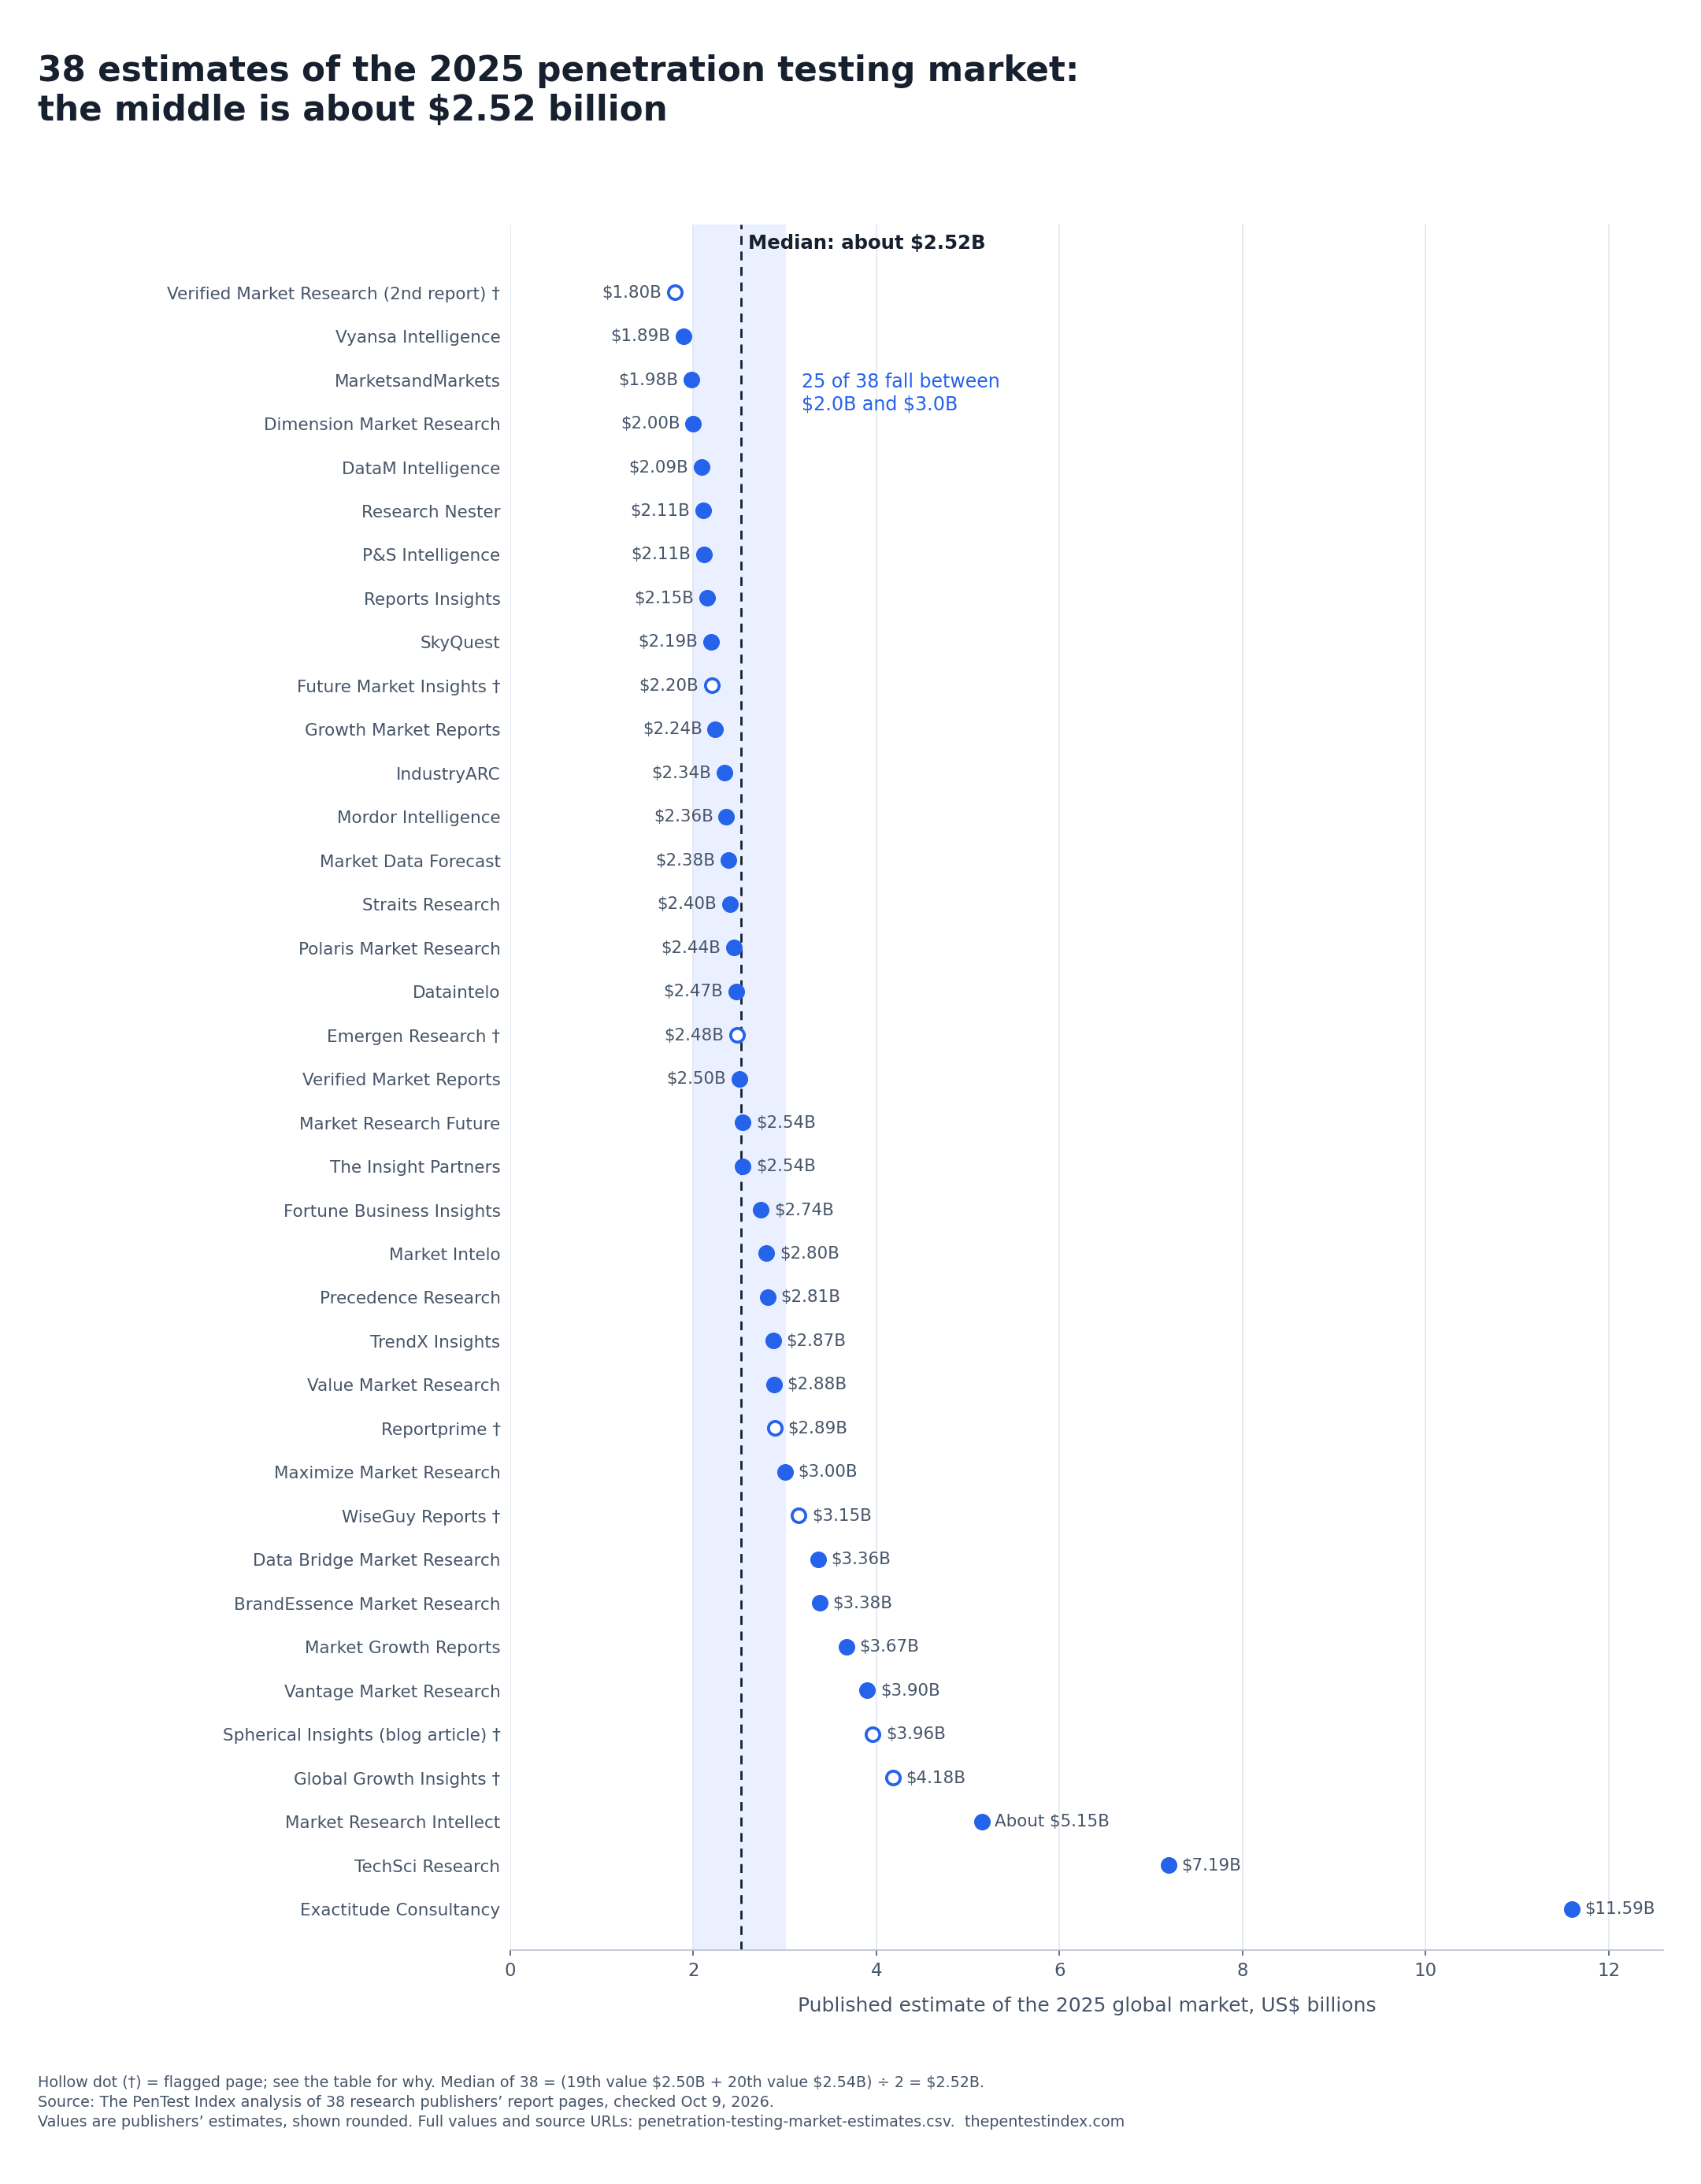
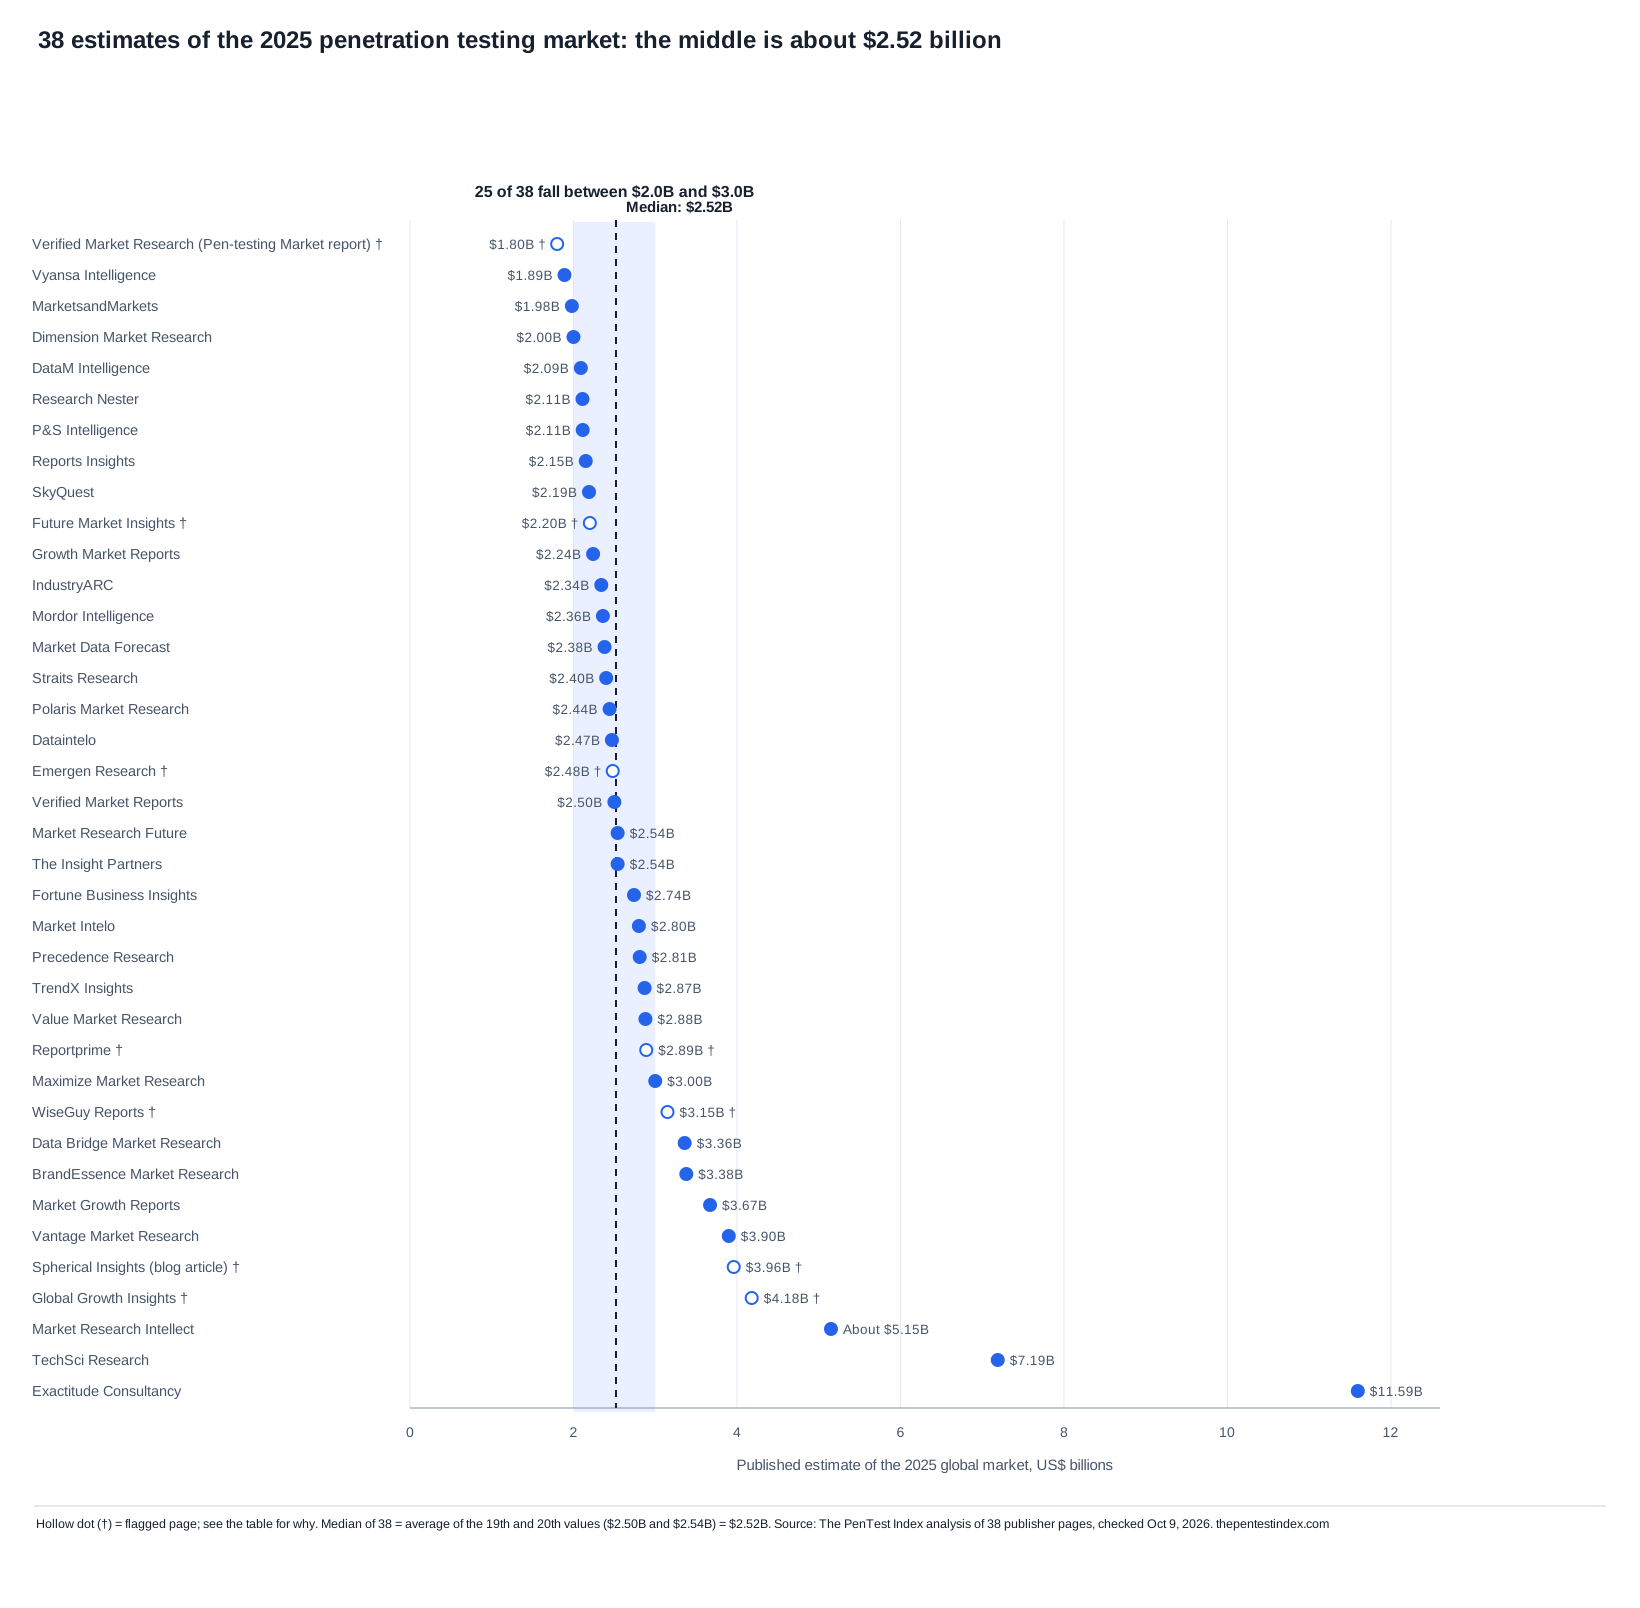
Median: about $2.52 billion from 38 accepted estimates for 2025.
Range: $1.80B to $11.59B. 25 of 38 (65.8%) fall between $2.0B and $3.0B.
Exact calculation value
Median: $2.52 billion; range: $1.800000–$11.594500 billion.
The median of 38 published estimates puts the global penetration testing market at about $2.52 billion in 2025, according to The PenTest Index (October 9, 2026). Source: The PenTest Index, https://thepentestindex.com/research/penetration-testing-market/#estimate-tracker. Deep link: https://thepentestindex.com/research/penetration-testing-market/#estimate-tracker
| Include | ||||||
|---|---|---|---|---|---|---|
| BrandEssence Market Research | $3.38B | Dec 2025 | 2032: $9.54B | 15.97% | — | |
| Data Bridge Market Research | $3.36B | May 12, 2026 | 2033: $14.44B | 20.0% | — | |
| Dataintelo | $2.47B | Oct 5, 2026 | 2034: $7.72B | 13.5% | — | |
| DataM Intelligence | $2.09B | Apr 23, 2026 | 2033: $7.08B | 16.3% | — | |
| Dimension Market Research | $2.0B | Aug 2025 | 2034: $8.7B | 17.7% | — | |
| Emergen Research | $2.48B | Aug 4, 2026 (modified) | 2035: $9.42B | 14.6% | † | |
| Exactitude Consultancy | $11.5945B | Aug 27, 2026 | 2035: $28.2134B | 9.3% | — | |
| Fortune Business Insights | $2.74B | Sep 21, 2026 | 2034: $7.41B | 11.6% | — | |
| Fundamental Business Insights | — | Jul 2026 | 2036: $11.76B | 15.77% | — | |
| Future Market Insights | $2.2B | Sep 9, 2025 | 2035: $8.4B | 14.4% | † | |
| Global Growth Insights | $4.18B | Sep 16, 2025 | 2034: $12.67B | 13.1% | † | |
| Growth Market Reports | $2.24B | Jun 2026 | 2034: $6.99B | 13.7% | — | |
| IndustryARC | $2.34B | Not shown | 2032: $6.03B | 14.5% | — | |
| Market Data Forecast | $2.38B | Oct 2026 | 2034: $7.56B | 13.7% | — | |
| Market Growth Reports | $3.67057B | Sep 9, 2026 | 2035: $25.35781B | 21.4% | — | |
| Market Intelo | $2.8B | Jun 11, 2026 | 2034: $7.9B | 13.7% | — | |
| Market Research Future | $2.54B | Sep 15, 2026 | 2035: $9.62B | 14.2% | — | |
| Market Research Intellect | $5.15B, approximately $5.15B | May 31, 2025 | 2035: $19.96B | 14.5% | — | |
| MarketsandMarkets | $1.98B | Mar 2026 | 2031: $4.39B | 14.2% | — | |
| MarkWide Research | — | May 2026 | 2035: $8.82B | 13.6% | — | |
| Maximize Market Research | $3.0B | May 18, 2026 | 2032: $8.74B | 16.5% | — | |
| Mordor Intelligence | $2.36B | Sep 11, 2026 | 2031: $5.54B | 15.29% | — | |
| P&S Intelligence | $2.1127B | Not shown | 2030: $4.7078B | 17.2% | — | |
| Polaris Market Research | $2.44165B | Oct 9, 2026 (updated; as printed) | 2034: $9.57762B | 16.4% | — | |
| Precedence Research | $2.81B | Sep 23, 2026 | 2035: $8.51B | 11.72% | — | |
| Reportprime | $2.89B | Jul 2026 | 2031: $5.92B | 13.2% | † | |
| Reports Insights | $2.15B | Aug 1, 2025 | 2033: $6.04B | 13.8% | — | |
| Research Nester | $2.11B | Mar 12, 2026 | 2035: $9.63B | over 16.4% | — | |
| SkyQuest | $2.19B | Nov 2025 | 2033: $7.74B | 17.1% | — | |
| Spherical Insights (blog article) | $3.96B | Jul 2026 | 2035: $14.28B | 13.69% | † | |
| Straits Research | $2.4B | Aug 24, 2026 | 2034: $8.63B | 15.28% | — | |
| TechSci Research | $7.19B | May 2026 | 2031: $17.86B | 16.37% | — | |
| The Insight Partners | $2.54B | Apr 28, 2026 | 2034: $9.8B | 16.21% | — | |
| TrendX Insights | $2.87B | May 2026 | 2034: $8.76B | 13.2% | — | |
| Value Market Research | $2.88B | Sep 24, 2026 | 2034: $10.46B | 15.41% | — | |
| Vantage Market Research | $3.9B | Jun 2026 | 2035: $14.8B | 14.3% | — | |
| Verified Market Reports | $2.5B | May 31, 2026 | 2032: $5.9B | 13.05% | — | |
| Verified Market Research (Pen-testing Market report) | $1.8B | Jul 2026 | 2033: $2.66B | 5.0% | † | |
| Vyansa Intelligence | $1.89B | Not shown | 2032: $5.04B | 15.04% | — | |
| WiseGuy Reports | $3.15B | Aug 2026 | 2035: $8.0B | 9.8% | † |
Source: each publisher's report page, linked in the table, checked October 9, 2026. Values are in US$ billions, rounded here to two decimals; the CSV keeps the source precision and qualifiers. Median, flags and arithmetic: The PenTest Index. † = flagged page. Page dates are the ones each page shows. Rows without an accepted figure for 2025 are disabled. 38 accepted figures are available.
Which number should you cite?
If you want one firm's view, quote that firm's number and name it, with the year the number is for and the date on its page. If you want to describe the range of published views, cite the median and its 38-source scope. It doesn't lean on any one model, but it is not a measured market total. Either way, keep three things in the sentence: the year, the word "global," and the word "estimate."
Two traps catch writers. The first is quoting a forecast as today's size. A "$5.54 billion by 2031" figure is a guess about 2031, not a 2026 number. The second is joining a starting value from one edition of a report to an end value from another. Editions change, sometimes a lot (see past forecasts).
What is the penetration testing market worth in 2026?
The median of the 17 pages that give a usable 2026 figure is $2.91 billion. They range from $2.30 billion to $5.90 billion. Leave out the highest page and the median is $2.87 billion. Leave out the lowest and it's $3.00 billion. Without the one flagged page, the median is $2.87 billion across 16 pages.
| # | Publisher | 2026 estimate |
|---|---|---|
| 1 | Vyansa Intelligence | $2.30B |
| 2 | Research Nester | $2.42B |
| 3 | Market Data Forecast | $2.71B |
| 4 | Mordor Intelligence | $2.72B |
| 5 | Fundamental Business Insights | $2.72B |
| 6 | Straits Research | $2.77B |
| 7 | MarkWide Research | $2.80B |
| 8 | Polaris Market Research | $2.84B |
| 9 | Market Research Future | $2.91B (middle) |
| 10 | Fortune Business Insights | $3.09B |
| 11 | TrendX Insights | $3.10B |
| 12 | Precedence Research | $3.14B |
| 13 | Market Intelo | $3.20B |
| 14 | Value Market Research | $3.32B |
| 15 | Market Growth Reports | $4.46B |
| 16 | Global Growth Insights † | $4.73B |
| 17 | Market Research Intellect | $5.90B |
Source: each publisher's report page, linked, checked October 9, 2026. Values in US$ billions; the CSV keeps source precision. Median: The PenTest Index.
The 2026 list is not the same set of pages as the 2025 list. Two pages here give no 2025 figure, and 23 of the 38 pages in the tracker give no 2026 figure. So don't read $2.52 billion and $2.91 billion as one year's growth. Look at only the 15 pages that give both years instead: their 2025 median is $2.74 billion, and their typical rise from 2025 to 2026 is 14.6%. Here, “typical rise” means the median of the 15 separate percentage changes.
Two readable original-publisher pages print a 2026 figure we don't use. Reportprime's table says $2.89 billion for 2026, but the top of the same page ties $2.89 billion to 2025. Grand View Research shows a card reading “Market Estimate, 2026: $2.1B”; its main scope table gives $2.09 billion for 2024. We withhold that card because its year is unclear against the main report's 2024–2030 scope. The reseller-only 360iResearch figure is also excluded, as the source note explains.
Does the middle hold up?
Mostly, yes. We worked the median out 11 other ways. It stays between $2.36 billion and $2.64 billion every time, and between $2.48 billion and $2.64 billion in every check except the last one, which keeps only three firms.
| What we changed | Pages | Median for 2025 |
|---|---|---|
| All 38 accepted pages | 38 | $2.52B |
| Leave out the 7 flagged pages (†) | 31 | $2.50B |
| Leave out the lowest page (Verified Market Research's second report) | 37 | $2.54B |
| Leave out the highest page (Exactitude Consultancy) | 37 | $2.50B |
| Leave out the three highest pages | 35 | $2.48B |
| Leave out Emergen Research (flagged) | 37 | $2.54B |
| Use Emergen Research's FAQ figure ($2.84B) instead of its main figure | 38 | $2.54B |
| Leave out Market Research Future and Value Market Research (share-pattern check) | 36 | $2.49B |
| Only pages dated 2026 | 28 | $2.64B |
| Hypothetically add Global Insight Services at its disputed $2.30B table value | 39 | $2.50B |
| Count each verified same-owner brand pair once (average of the pair) | 36 | $2.51B |
| Only Mordor Intelligence, Fortune Business Insights and MarketsandMarkets | 3 | $2.36B |
Source: The PenTest Index arithmetic on penetration-testing-market-estimates.csv, October 9, 2026. The Global Insight Services row is a what-if check of a disputed value, not an accepted estimate. The calculation script in the data pack defines every selection.
Stack cuts on top of each other and the median still stays close. Any two of the seven cuts that remove pages keep it between $2.46 billion and $2.74 billion, with as few as 23 pages left. Any three keep it between $2.42 billion and $2.77 billion, with as few as 21. These seven cuts are the flagged, lowest, highest, three-highest, Emergen, share-pattern and date cuts; the three-firm preset is not one of them. The fewer pages you keep, the more one page can move the middle.
The two pages at the middle are now unflagged. Emergen Research, a flagged page near the middle, says $2.48 billion for 2025 in its main text and $2.84 billion in its FAQ. Use the FAQ figure and the median becomes $2.54 billion. Leave the page out and it's also $2.54 billion.
What holds up less well is the spread. Three pages sit far above the rest: Market Research Intellect (approximately $5.15 billion), TechSci Research ($7.19 billion) and Exactitude Consultancy ($11.59 billion). The other 35 run from $1.80 billion to $4.18 billion. Across all 38, the top is 6.4 times the bottom. Without those three, it's 2.3 times.
Pages not used in the 2025 median
The 78 listed report entries leave 40 outside the 2025 median: six are set aside, three could not be retrieved, and 31 have no usable 2025 figure. Two of those 31 give a 2026 figure used above. Each is listed with the reason.
| Publisher | Page date | What the page gives | Why it is not in the 2025 median |
|---|---|---|---|
| 360iResearch (via GII reseller listing) | Jul 22, 2026 (listing) | No market-size figures accepted in this audit. | GII attributes figures to 360iResearch, but the publisher's own current summary omits market sizing. No original-publisher figure could be verified; numeric cells are withheld. |
| Cognitive Market Research | Aug 2026 | No market-size figures accepted in this audit. | The publisher says its charts, graphs, numbers and data are representative and do not depict actual statistics. Numeric cells are withheld. |
| Data Insights Market | Not verified (page unavailable) | No market-size figures accepted in this audit. | The cited page returns HTTP 410, 'Report No Longer Available'. Earlier draft figures could not be rechecked; numeric cells are withheld. |
| Market Glass, Inc. (Global Industry Analysts) via Research and Markets | Oct 2026 | No market-size figures accepted in this audit. | The reseller listing is readable. The publisher's StrategyR page is under maintenance and its Acumen.biz report page gives no market sizing. No original-publisher figure could be verified; numeric cells are withheld. |
| Fundamental Business Insights | Jul 2026 | 2026: $2.72B; 2036: over $11.76B; 15.77%. | Base year is 2026; no 2025 value. Forecast is stated as exceeding $11.76B by 2036. |
| MarkWide Research | May 2026 | 2026: $2.80B; 2035: $8.82B; 13.6%. The title and CAGR row instead use 2036. | Base year is 2026; no 2025 value. Opening gives $8.82B by 2035, while the CAGR row and title use 2036. |
| 6Wresearch | Sep 2026 | 'USD 800 Billion' for 2025; 'USD 1900 Billion' by 2032; 10.6% | Set aside: the printed unit is unresolved. $800B is far above all other pen testing estimates here and Gartner’s broader $213.025B information-security forecast; that comparison is a warning, not proof of the correct unit. |
| Global Insight Services | Feb 2026 | 2024: $2.3B; 2034: $7.9B; about 11.8%. Highlights table instead ties $2.3B to 2025 and $7.9B to 2035. | Main sentence and highlights table shift both base and forecast years; metadata instead says $2.5B for 2024, $7.5B for 2034 and about 11.6%. No clear comparable 2025 figure. |
| Verified Market Reports (Pen-testing Market page) | Apr 23, 2026 | '5.6 billion' (no currency) for 2025 and for 2024; '13.4 billion' by 2034 or 2033; 10.3% | Second page from the same firm; ties the same number to two years and names no currency. The firm's main page is used. |
| Adroit Market Research | Not verified (page unavailable) | No market-size figures accepted in this audit. | The cited page could not be retrieved: scraper error, browser fetch timeout and direct HTTP 502. Earlier draft figures could not be rechecked; numeric cells are withheld. |
| Allied Market Research | Oct 2022 | 2021: $1.60B; 2031: $5.30B; 13.1% | 2021 base; no 2025 value. |
| Coherent Market Insights | 31 Oct 2026 (as printed) | No market size on the public page | No market size or growth rate shown. |
| Consainsights | Jan 31, 2026 | 2023: $3.50B; 2033: $8.04B; 8.4% | No 2025 value; two 2023 sizes ($3.5B and $5.15B) and two growth rates on one page. |
| Credence Research | Feb 23 (no year shown) | 2024: $1.73459B; 2032: $5.50280B; 15.71%. No 2025 value. | No 2025 value. |
| Cybersecurity Ventures | Aug 14, 2023 | More than $5B a year by 2031 | Only a floor for 2031; an average of forecasts it does not name. |
| Fatpos Global | Nov 3, 2025 | 2023: $1.80B; 2034: $8.20B; 14.4% | No 2025 value. |
| Global Market Estimates | Sep 14, 2024 | No market size on the public page | No market size or growth rate shown. |
| Global Market Insights | Apr 2024 | 2023: $2.80B; 2032: $11.60B; over 17%. | No 2025 value; April 2024 edition. |
| GMI Research | Jun 2020 | 2027: $3.90B; 13.8% | Old edition; no starting value. |
| Grand View Research | Last updated May 2026 | 2023: $1.82B; 2024: $2.09B; 2030: $5.24B; 16.6% | No 2025 value. A card explicitly labels $2.1B as 2026; the main scope table gives $2.09B for 2024. The 2026 card is withheld because its year is unclear against the main 2024–2030 scope. |
| HTF Market Intelligence | Oct 5, 2026 | 2024: $2.0071B; 2031: $8.167B; 22.2% CAGR (2024–2031). | No 2025 value. |
| IMIR Market Research | Jul 2022 | 2021: $4.93B; 2028: $6.83B; 13.53% | Old edition; stated growth rate does not reproduce. |
| KBV Research | Not verified (page unavailable) | No market-size figures accepted in this audit. | The cited page returns HTTP 404. Earlier draft figures could not be rechecked; numeric cells are withheld. |
| Ken Research | Aug 2025 | $2.45B with no year attached | No year attached to the figure. |
| Kenneth Research | Oct 21, 2022 | 'Around USD 2.6 billion by 2027'; about 14.2% | Old edition; end-year figure only. |
| Knowledge Sourcing Intelligence | Apr 7, 2026 | 2022: $1.78B; 2029: $4.35B; 13.22% | No 2025 value. |
| Lucintel | May 2026 | 2030: $4.40B; 19.8% | No starting value. |
| Markets and Data | Jan 2025 | 2024: $2.51B; 2032: $7.52B; 14.7% | No 2025 value. |
| Meticulous Research | Oct 2022 | 2029: $4.05B; 12.5% | No starting value. |
| Orion Market Research (OMR Global) | Feb 2026 | 2024: $1.58B; 2035: $9.12B; 17.4% | No 2025 value. |
| Report Ocean | Jun 23, 2022 | 2021: $1.51B; 2030: $4.10B; 12.1% | Old edition. |
| SNS Insider | Sep 14, 2024 | 2023: $1.57B; 2032: $6.71B; 18.73% | No 2025 value; the firm's own Aug 30, 2024 release gives different numbers ($1.92B in 2023 to $6.98B by 2032). |
| Strategic Market Research | Nov 2025 | 2024: $3.20B; 2030: $6.90B; 13.6% | No 2025 value. |
| Stratistics MRC | 2024 | 2023: $3.21B; 2030: $8.33B; 14.3% | No 2025 value. |
| Technavio | Mar 2025 | Growth only: 16.8% a year, an increase of USD 2.77B | No total market value. |
| Transparency Market Research | Not shown ('Upcoming') | No market size on the public page | No market size or growth rate shown. |
| Up Market Research | Aug 21, 2021 | No market size on the public page | No market size; growth printed as 'XX%'. |
| Verified Market Research (main report) | Nov 2025 | 2024: $2.45B; 2032: $6.25B; 12.5% | No 2025 value; the firm's second report is used. |
| Virtue Market Research | Jul 2023 | No market size on the public page | No market size or growth rate shown. |
| Zion Market Research | Not shown ('Upcoming') | 2023: $2.89B; 2032: $9.29B; 12.4% | No 2025 value; stated growth rate does not reproduce. |
Source: the linked pages and current retrieval results, checked October 9, 2026. Unavailable and reseller-only figures have no accepted numeric cells in the dataset. A failed fetch does not establish that a report no longer exists elsewhere.
How fast is the penetration testing market growing?
Research firms expect the penetration testing market to grow about 14.5% a year. That's the median forecast rate across the 38 report pages. 27 stated rates fall between 13% and 17%. Another page, Research Nester, says only “over 16.4%,” so it cannot be counted inside that band. The 37 point rates run from 5% to 21.4%. These are forecasts over periods that end between 2030 and 2035, not measured growth.
To make that concrete: at 14.5% a year, a market roughly doubles in five years.
Three ways of taking the middle all land close together. The median of the stated rates is 14.45%, shown here as about 14.5%. Research Nester's lower bound is above the middle, so its unknown exact rate cannot move that median. Worked out from each page's own 2025 value and point forecast (37 pages), it's 14.3%. Without the flagged pages, the median stated rate is 15.0%. The lowest rate, 5%, is on a flagged page. The highest point rate, 21.4%, is on Market Growth Reports' current 2026–2035 edition.
What does CAGR mean?
CAGR stands for compound annual growth rate. It's the steady yearly rate that would carry a starting value to an ending value. Real markets don't grow that smoothly, so a CAGR is a summary, not a prediction for any single year.
Here's one firm's rate checked by hand. Mordor Intelligence puts 2026 at $2.72 billion and 2031 at $5.54 billion. That's five years of growth: (5.54 ÷ 2.72)^(1/5) − 1 = 15.29%, which matches the 15.29% Mordor prints (Mordor Intelligence). Don't run that formula backward to make up a figure for a year the firm didn't publish.
How big will the market be by 2030, 2032 or 2034?
Most forecasts aim at 2034 or 2035. Twelve of the 38 pages forecast 2034, with a median of about $8.7 billion, and 11 of those 12 fall between $6.99 billion and $10.46 billion. For 2035, ten point forecasts run from $8.00 billion to $28.21 billion. One other page, Research Nester, says only that the market will exceed $9.63 billion. A point forecast gives one estimated value; “over” gives only a floor.
| Forecast ends in | Point forecasts | Lowest | Highest | Median | Median without flagged pages |
|---|---|---|---|---|---|
| 2030 | 1 | $4.71B (P&S Intelligence) | — | Too few to take a middle | Too few |
| 2031 | 4 | $4.39B (MarketsandMarkets) | $17.86B (TechSci Research) | $5.73B | $5.54B (3 pages) |
| 2032 | 5 | $5.04B (Vyansa Intelligence) | $9.54B (BrandEssence Market Research) | $6.03B | $6.03B (5 pages) |
| 2033 | 5 | $2.66B (Verified Market Research (Pen-testing Market report) †) | $14.44B (Data Bridge Market Research) | $7.08B | $7.41B (4 pages) |
| 2034 | 12 | $6.99B (Growth Market Reports) | $12.67B (Global Growth Insights †) | $8.67B | $8.63B (11 pages) |
| 2035 | 10 | $8.00B (WiseGuy Reports †) | $28.21B (Exactitude Consultancy) | $11.95B | $17.38B (6 pages) |
Source: the 38 pages in the Estimate Tracker, each counted under its own forecast end year; The PenTest Index arithmetic. Research Nester's “exceed $9.63B” is a lower bound and is outside these point-forecast medians. “About” and “nearly” remain visible source qualifiers. The CSV retains full precision.
Starting years differ, so treat each median as a guide. For 2035 the point-forecast median jumps from $11.95 billion to $17.38 billion when flagged pages are left out, so 2035 is too unsettled for one headline number. Six of the 78 entries have 2030 as their selected main forecast year, from $4.10 billion to $8.33 billion; only P&S Intelligence ($4.71 billion) also has an accepted 2025 figure. This count leaves out alternate or conflicting forecast passages, such as IndustryARC’s $4.6 billion for 2030. This page reports other people's forecasts. It doesn't make one.
Why do penetration testing market estimates differ so much?
The free report pages don't say enough to tell. Eighteen of the 38 say they count both testing services and testing software or “solutions,” and those still range from $1.80 billion to $3.36 billion. The other 20 don't say whether software is counted, and that group holds the widest gaps: $1.89 billion to $11.59 billion. The working behind each figure sits in a paid report, so the gap is easy to show and hard to explain.
Think of “the pizza market.” One firm counts pizza shops. Another adds frozen pizza. A third adds delivery apps. All three can be careful and still land far apart. Here, 20 of the 38 pages don't even say which pizzas they counted.
| What the page says | Pages | 2025 values | Median | Without flagged pages |
|---|---|---|---|---|
| Counts testing services and software or “solutions” | 18 | $1.80B to $3.36B | $2.42B | $2.00B to $3.36B |
| Does not say whether software is counted | 20 | $1.89B to $11.59B | $2.94B | $1.89B to $11.59B |
Source: the 38 pages in the Estimate Tracker, checked October 9, 2026. Sorting a page's wording into a group is a judgment; the legacy column name says_counts_services_and_software in the dataset now means an explicit services plus software/solutions split. “Solutions” need not mean software alone. Using software to do a test does not by itself mean software sales are included.
Examples in the second group that describe testing services without a software-sales component include MarketsandMarkets, Vyansa Intelligence, IndustryARC, TechSci Research and Verified Market Reports. Among the six pages with a clear 2025 component leader, five put services first and one puts software or ‘solutions’ first. The five services shares run from 58.5% to nearly 65%. A seventh page, Future Market Insights, gives both answers: services at 54.6% and software at 65.1% in different places. The classification dataset records each source, year and decision.
When one firm gives two answers
Some of the gap is inside single firms. A few examples, all on pages checked October 9, 2026:
- Verified Market Research has two live reports: $2.45 billion for 2024 in one, $1.80 billion for 2025 in the other.
- Future Market Insights prints three 2025 values on one page: $2.2 billion, $1,913.6 million and $1,676.6 million.
- Reportprime ties $2.89 billion to 2025 at the top of its page, then to 2026 in its overview, scope table and FAQ.
- MarketsandMarkets' U.S. page shows nearly the same dollars as its global page: $1.98 billion for 2025 on both, and $4.38 billion against $4.39 billion for 2031 (U.S. page).
- Fortune Business Insights gives two North America shares for 2025 (35.10% and 39.70%), and its regional dollar values add up to $3.39 billion, not its $2.74 billion total.
- Brands that name the same owner disagree. Market Research Future ($2.54 billion) and WiseGuy Reports ($3.15 billion) both name WantStats. Growth Market Reports ($2.24 billion) and Market Intelo ($2.80 billion) both say they are products of DataIntelo Solutions LLP.
Some estimates share a pattern
Two pages track Mordor Intelligence's slices very closely. Market Research Future's six 2025 shares are each a bit smaller than Mordor's, but its total is bigger. Turn each slice into dollars and the two pages land within 1% of each other on every slice. Value Market Research's six shares are each 1.14 to 1.25 percentage points above Mordor's. We don't know why either match happens or which page came first.
| 2025 share of the market | Mordor Intelligence | Market Research Future | Value Market Research |
|---|---|---|---|
| North America | 38.27% | 35.4% | 39.42% |
| Network testing | 38.23% | 35.3% | 39.48% |
| Banking and finance | 28.68% | 26.5% | 29.86% |
| Large companies | 67.83% | 62.8% | 68.97% |
| On-premises | 59.21% | 54.8% | 60.36% |
| Outside testers | 73.44% | 67.9% | 74.58% |
Source: Mordor Intelligence, Market Research Future and Value Market Research report pages, checked October 9, 2026. Dollar comparison: The PenTest Index arithmetic (share × each page's 2025 total).
The verified owner pairs show that not every brand is a separate publisher. Matching shares alone do not prove shared methods. Leave Market Research Future and Value Market Research out and the median is $2.49 billion. Count each pair of same-owner brands as one page (the average of the pair) and it's $2.51 billion.
Have past forecasts for this market held up?
Mostly they sit above what the same firms say now. In 6 of the 7 cases we could check, a firm's current figure is lower than its older edition pointed to, and in the seventh the two are about level. In March 2020, MarketsandMarkets forecast $4.5 billion by 2025. Its March 2026 edition puts 2025 at $1.98 billion, 56% lower.
| Publisher | Edition | What it said | Yearly growth it assumed | The same publisher now | Difference | How we lined them up |
|---|---|---|---|---|---|---|
| MarketsandMarkets | 2020-03-12 | $1.70B in 2020 to $4.50B by 2025 | 21.8% | Current page: $1.98B for 2025 | 56.0% lower | Same year, both figures as printed |
| MarketsandMarkets | 2021-08-10 | $1.60B in 2021 to $3.00B by 2026 | 13.8% | Current edition implies about $2.26B for 2026 | 24.6% lower | Our arithmetic: 1.98 x 1.142 |
| MarketsandMarkets | 2022-08-24 | $1.40B in 2022 to $2.70B by 2027 | 13.7% | Current edition implies about $2.58B for 2027 | 4.4% lower | Our arithmetic: 1.98 x 1.142^2 |
| MarketsandMarkets | 2024-04-03 | $1.70B in 2024 to $3.90B by 2029 | 17.1% | Current edition implies about $3.37B for 2029 | 13.6% lower | Our arithmetic: 1.98 x 1.142^4 |
| Verified Market Research | 2018-09-19 (issuer release, republished copy) | $0.60B in 2016 to $4.14B by 2025 | 23.95% | Main report: $2.45B for 2024 (about $2.76B for 2025 at 12.5%); second report: $1.80B for 2025 | 33.4 to 56.5% lower | Lower gap: our arithmetic 2.45 x 1.125; higher gap: second report as printed |
| Fortune Business Insights | 2023-09-18 | $1.98B in 2022 to $5.10B by 2030 | 12.8% | Older edition implied about $2.84B for 2025; current page says $2.74B | 3.6% lower | Our arithmetic: 1.98 x 1.128^3 |
| Future Market Insights | 2023-11-09 | $1.91B in 2024 to $7.36B by 2034 | 14.4% | Older edition implied about $2.19B for 2025; current headline says $2.2B | About level (+0.5%) | Our arithmetic: 1.9136 x 1.144 |
| SNS Insider | 2024-08-30 | $1.92B in 2023 to $6.98B by 2032 | 15.46% | Its own report page says $1.57B for 2023 and $6.71B for 2032 | Not a comparison over time | Not a comparison over time: release and report page disagree |
Source: each edition's issuer press release, linked, and each firm's current report page, checked October 9, 2026. The 2018 Verified Market Research release survives as a copy distributed through an EmailWire site; that site is not a government source. “Our arithmetic” uses the edition and rate named in the last column: the current rate for MarketsandMarkets and Verified Market Research, and the older rate for Fortune and Future Market Insights.
| Publisher | Current edition | Starting value | Forecast | Yearly growth |
|---|---|---|---|---|
| MarketsandMarkets | March 2026 | 2025: $1.98B | 2031: $4.39B | 14.2% |
Source: current publisher page. This is the chart baseline, not an eighth older-edition comparison. The straight lines below join published endpoints; they do not show annual values.
Lines join published endpoints, not annual estimates. Each line runs from an edition's starting figure to its forecast, as printed in the firm's press releases (2020, 2021, 2022, 2024) and current report page (2026). Source: MarketsandMarkets, five editions. Chart: The PenTest Index, checked Oct 9, 2026.
Download PNGDownload SVG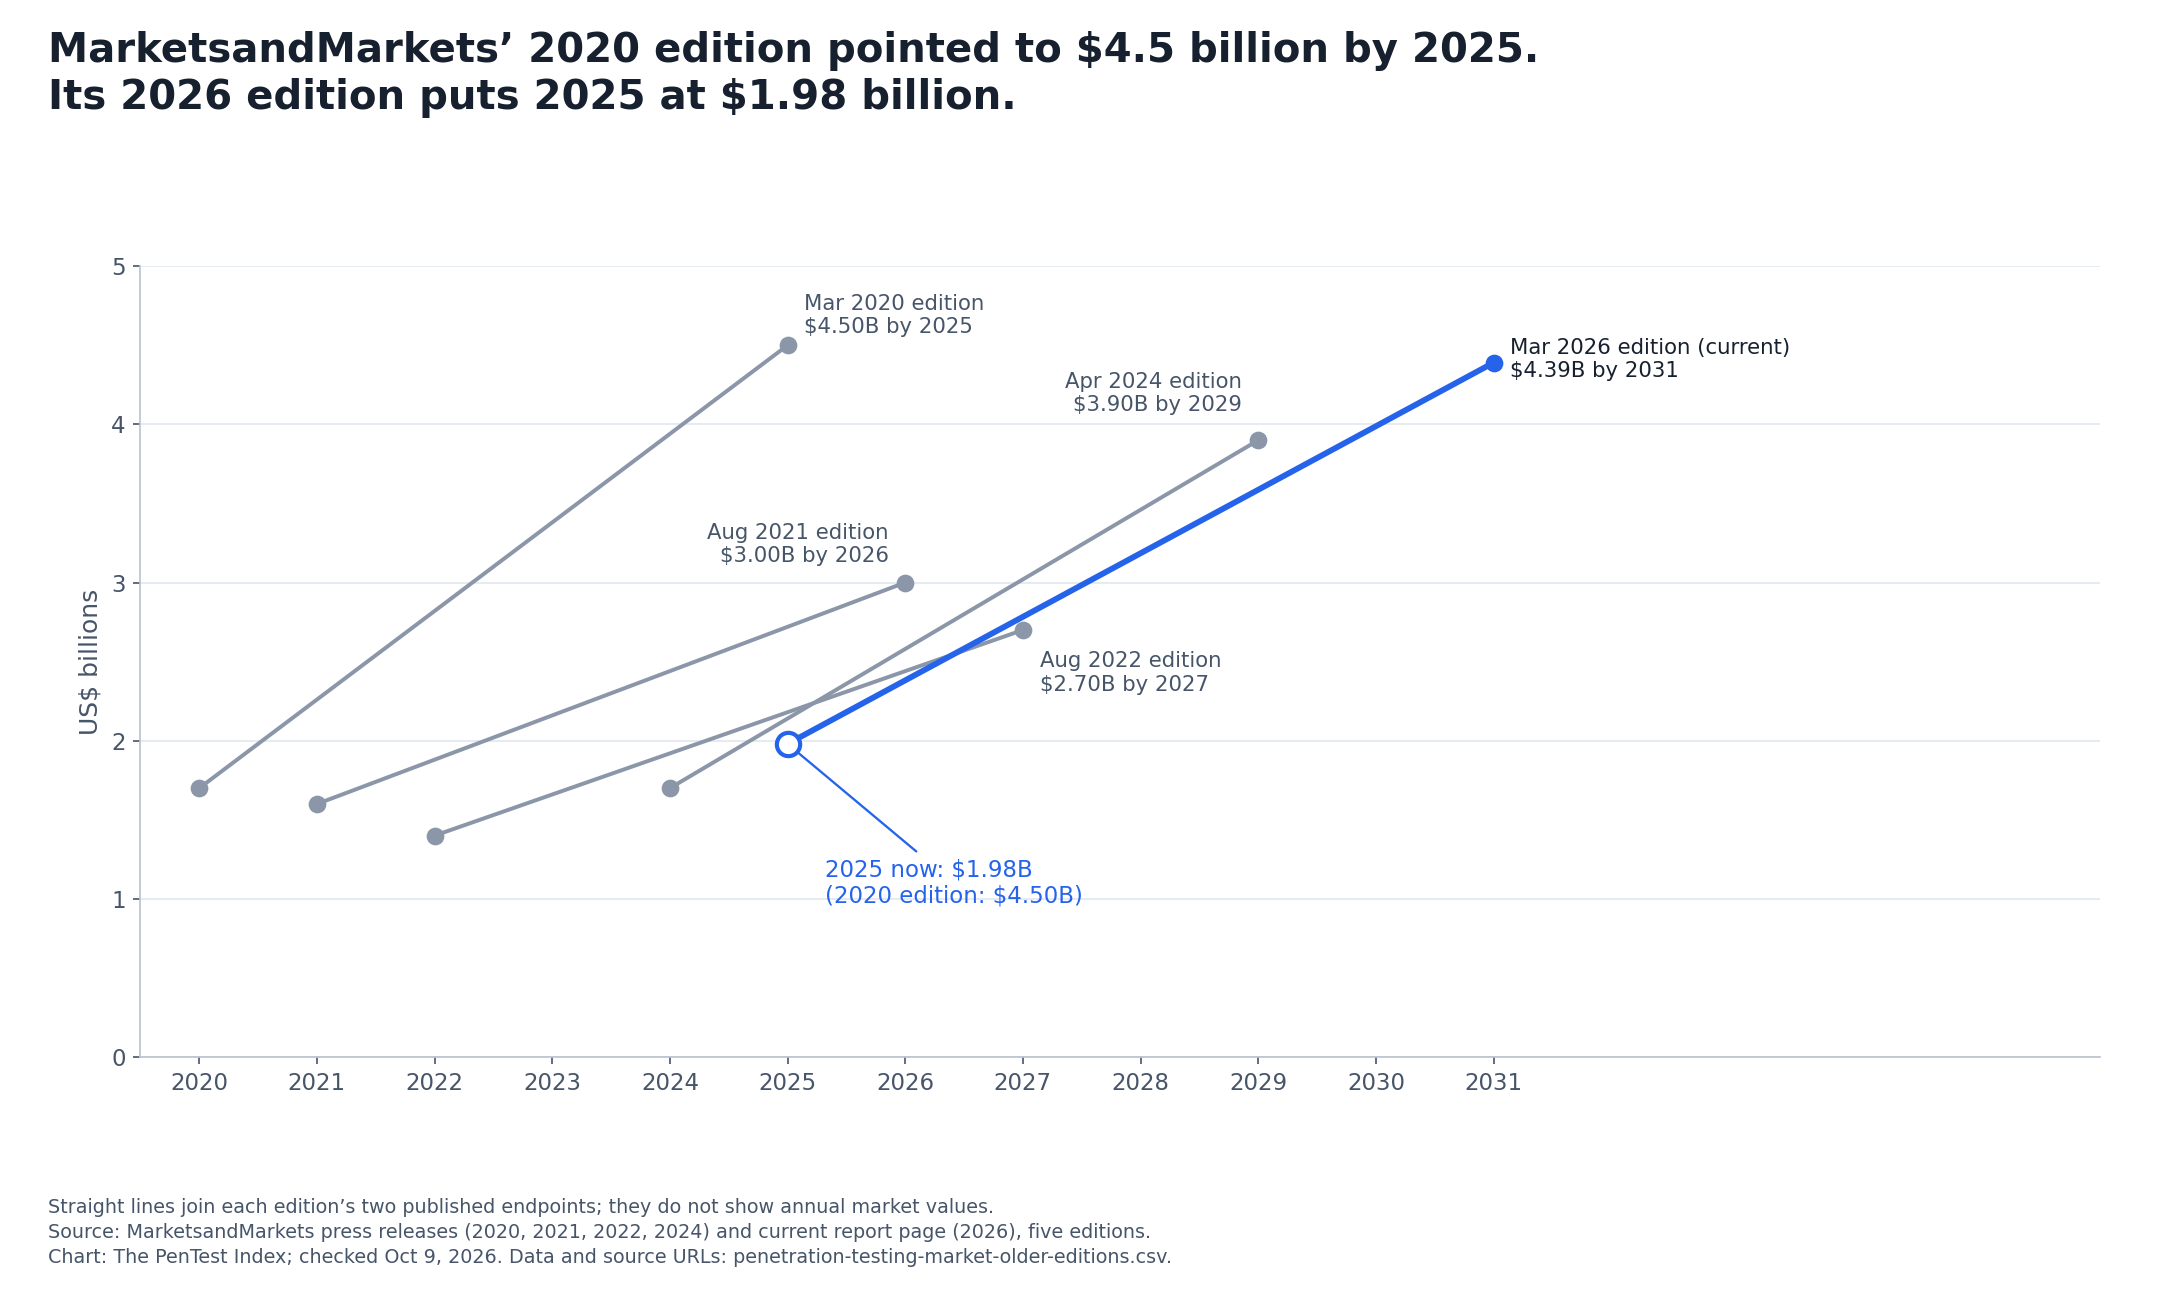
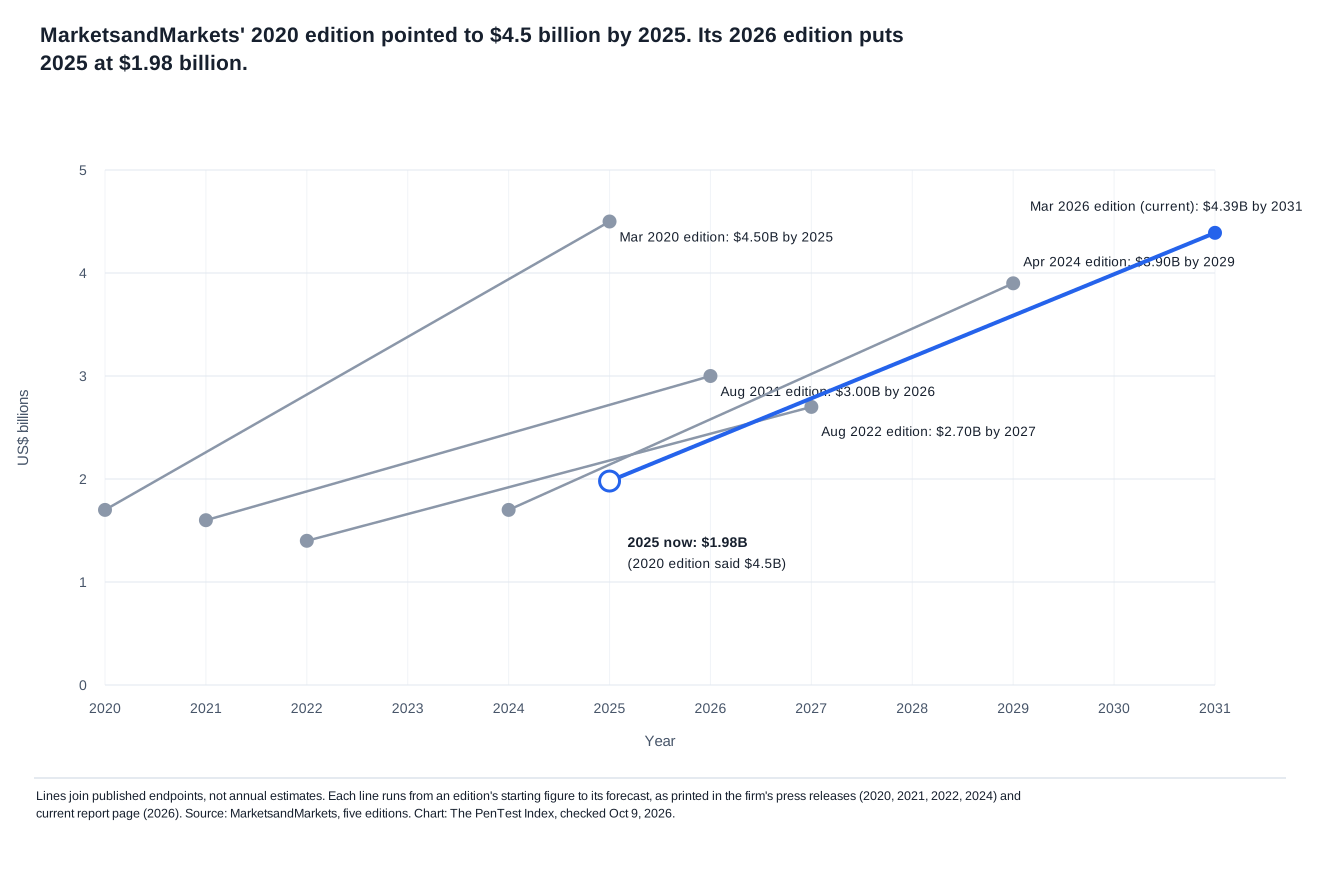
Read this table with care. Only the first row is a clean match: the same year, both numbers as printed, no flagged page. Every other row needed some arithmetic or uses a flagged page, and the last column says how. The seven cases come from four firms, and four of them are MarketsandMarkets editions. The two older editions with the biggest gaps both assumed growth above 20% a year (21.8% and 23.95%).
One figure went the other way. For 2024 itself, MarketsandMarkets' April 2024 edition said $1.70 billion and its current edition says $1.77 billion, about 4% more.
This compares each firm with itself. We found no measured total for this market, so this edition comparison cannot mark a forecast right or wrong.
Who spends the most on penetration testing?
North America's estimated share of 2025 penetration testing spending has a median of 37.5%, or about 38%, across 17 report pages. The shares run from 32% to about 43%. Banking and finance leads on 8 of the 10 pages with a clear industry leader for 2025. And bigger companies test far more often: in the UK 2025/26 survey, 60% of large businesses reported a pen test in the past 12 months, against 10% of the smallest.
Which region spends the most?
| Publisher | North America's share of 2025 spending | Note |
|---|---|---|
| Reportprime † | 32% | — |
| Market Intelo | 32.4% | The page puts Asia Pacific first, at 38.2%. |
| Fortune Business Insights | 35.1% | Same page also says 39.70%; regional dollar values do not sum to its headline total. |
| Market Research Future | 35.4% | Follows Mordor's share pattern. |
| Dimension Market Research | 35.8% | Projection from its August 2025 edition. |
| MarketsandMarkets | 35.9% | — |
| Growth Market Reports | About 37% | — |
| Straits Research | 37.5% | Opening and FAQ agree on 37.5% for 2025; other passages give 35% and 39% without a matching year. |
| Dataintelo | 37.5% | — |
| Precedence Research | Nearly 38% | — |
| Mordor Intelligence | 38.27% | — |
| Data Bridge Market Research | 38.5% | — |
| Value Market Research | 39.42% | Follows Mordor's share pattern. |
| Vyansa Intelligence | 40% | — |
| IndustryARC | 42% | — |
| Exactitude Consultancy | 42% | — |
| TrendX Insights | About 43% | — |
| Median of 17 | 37.5% (about 38%) |
Source: each publisher's report page, linked, checked October 9, 2026. We use explicitly year-labelled shares or shares in a clearly labelled 2025 regional breakdown. We do not infer a year from the article title alone. Median: The PenTest Index.
Twelve of the 17 fall between 35% and 40%. Global Growth Insights also prints 36%, but does not attach its regional shares to one year, so that value is outside this dated comparison. Asia Pacific is the fastest-growing region on all 23 pages that name one clear leader. Two other pages name Asia Pacific in one place and North America in another. Their forecast years differ; the classification dataset lists each period. These are counts of what pages say, not 23 independent measurements.
How big is the U.S. penetration testing market?
Two report pages give a 2025 U.S. figure we can use: $600 million from Dimension Market Research and $800.85 million from Precedence Research. That's 28.5% to 30% of each firm's own world total. Dimension's figure was a projection published during 2025.
| Publisher | U.S. market, 2025 | Its world total, 2025 | U.S. share (our arithmetic) | Note |
|---|---|---|---|---|
| Dimension Market Research | $600M | $2.00B | 30% | Printed as USD 0.6 billion; projection from August 2025. |
| Precedence Research | $800.85M | $2.81B | 28.5% | Full source precision shown. |
| MarketsandMarkets (U.S. page) | $1,980M | $1.98B | 100% | Excluded from the U.S. range: same dollars as its global page. |
Source: linked publisher pages, checked October 9, 2026. Cognitive's illustrative numbers and Market Glass's unverified reseller figures are excluded from this U.S. comparison for the same reasons as their global figures.
Which industries and kinds of test lead?
Most pages with a clear 2025 industry leader put banking and finance first: 8 of 10. The other two name IT and telecom (Precedence Research) and government and defense (Maximize Market Research). Examples of 2025 banking and finance shares include Mordor Intelligence (28.68%) and Dataintelo (28.0%). Market Research Future and Value Market Research give one too, but theirs follow the share pattern shown above.
Most pages with a clear 2025 leader by the system tested put network or infrastructure testing first: 9 of 12. The other three name web application testing: Vyansa Intelligence, Dimension Market Research and Polaris Market Research. Future Market Insights gives different leaders in different places, so it is outside this count. Black-box versus white-box testing and internal versus external testing are different groups, so they are outside this comparison too.
Source: the publisher pages linked in the Estimate Tracker, checked October 9, 2026. The classification dataset shows every included page, year and source passage locator. Clear 2025 projections count and keep that label; undated claims, other years and conflicting leaders stay outside these denominators. Global Growth Insights’ industry shares add to 107%, and its industry values add to $4.47 billion against a $4.18 billion headline, so that page does not establish a clear industry leader.
How many companies actually run a penetration test?
In the UK 2025/26 survey, 13% of businesses and 7% of charities said they had a penetration test in the past 12 months. By size, that's 10% of businesses with 1 to 9 staff, 21% with 10 to 49, 38% with 50 to 249, and 60% with 250 or more. Fieldwork ran from August to December 2025. In the previous survey, published in 2025, the figure for all businesses was 12%.
| Business size | Share | Businesses surveyed |
|---|---|---|
| 1–9 staff | 10% | 1,154 |
| 10–49 staff | 21% | 507 |
| 50–249 staff | 38% | 296 |
| 250+ staff | 60% | 155 |
| All businesses | 13% | 2,112 |
Source: UK Cyber Security Breaches Survey 2025/2026, data tables, Table 12. Percentages are weighted; respondent counts are not.
Businesses that had a penetration test in the past 12 months, by staff size. Large businesses: 155 surveyed; all businesses: 2,112. Source: UK Cyber Security Breaches Survey 2025/2026 (DSIT and Home Office), Table 12. Fieldwork: Aug–Dec 2025. Chart: The PenTest Index, checked Oct 9, 2026.
Download PNGDownload SVG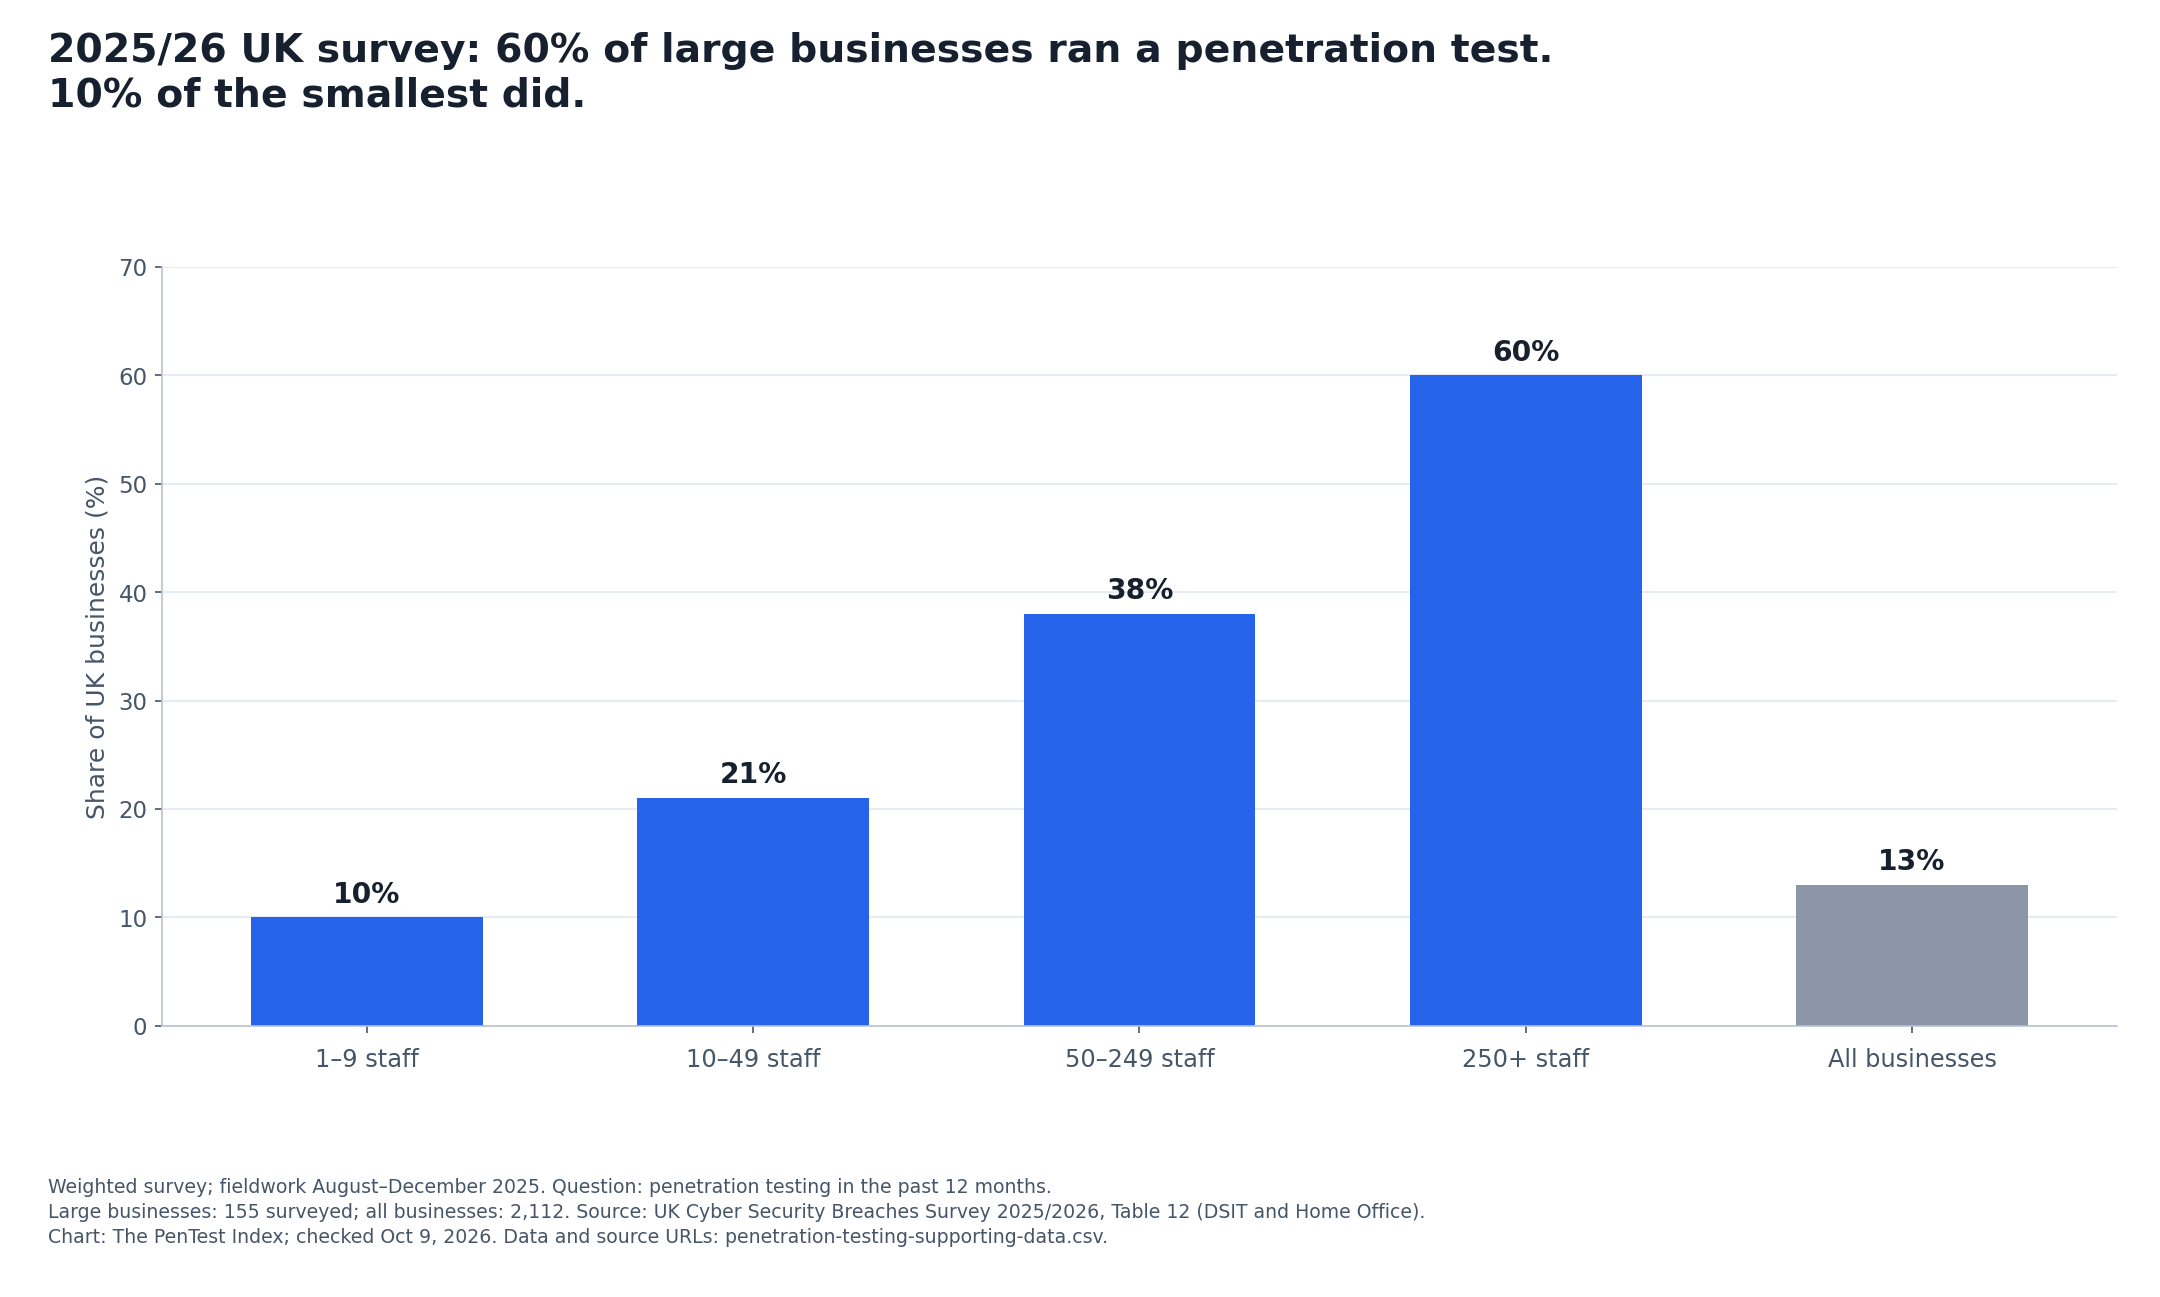
This is the official survey of pen test use used here. It covers the UK, it's what businesses said about themselves, and the large-business figure rests on 155 firms (UK Cyber Security Breaches Survey 2025/2026; size figures from its data tables; 2025 figure from the 2025 survey).
How much do companies budget for penetration testing?
In one vendor's survey, U.S. enterprises budgeted an average of $187,000 a year for pen testing. That was 11% of IT security budgets that averaged $1.77 million. The survey covered 500 security leaders at companies with more than 3,000 staff in the U.S., UK, Germany and France, and it was run for Pentera, which sells automated pen testing (Pentera’s issuer press release, May 8, 2025). Treat it as one seller's survey of very large companies, not a typical budget.
A market total can't price your own test. What one quote costs depends on what's tested, who does the testing, and what the price includes. You can compare penetration testing companies on their published prices and terms, and see how we check offers.
What do numbers from outside the market models show?
They're mixed. NCC Group, a London-listed security company, has a business line that includes penetration testing. That line took in £88.4 million in the year to September 30, 2025, 16.3% less than the year before, then held about level in the next six months. NetSPI and Synack merged on October 5, 2026 and said the combined company "is well over $200 million in revenue." And six companies selling automated or AI pen testing announced $771.5 million of funding from January 2025 to October 9, 2026.
| Period | Revenue | Change | Kind of figure |
|---|---|---|---|
| 12 months to May 31, 2023 | £142.9 million | — | Comparison figure in the August 2024 results |
| 12 months to May 31, 2024 | £107.0 million | Down 25.1% (down 22.8% at constant exchange rates) | Unaudited |
| 12 months to Sep 30, 2024 | £105.6 million | Year-end moved, so this overlaps the row above | Comparison figure |
| 12 months to Sep 30, 2025 | £88.4 million | Down 16.3% (down 15.0% at constant exchange rates) | Audited |
| 6 months to Mar 31, 2026 | £45.0 million | Down 1.3% from £45.6 million (up 0.2% at constant exchange rates) | Unaudited |
Source: NCC Group plc results for the 12 months to May 31, 2024, results for the year to September 30, 2025, and interim results, June 11, 2026 (republished announcement). NCC lists penetration testing, attack simulation and application security under this line (NCC Group).
“Audited” means the financial results were subject to an independent audit; it does not turn this mixed-service business line into a pen testing-only total. In its 2025 results, NCC said demand "has recovered more slowly than expected." In June 2026 it pointed to "a reduction in Technical Assurance Services revenue from large technology clients" in North America. One company isn't the market, but it's one of the few reported sales figures for a business line that includes pen testing.
NetSPI and Synack announced their merger on September 2, 2026, saying "The combined company is well over $200 million in revenue" (NetSPI). Synack says the deal closed on October 5, 2026 (Synack). That's a company statement with no period given, not an audited figure. For scale only: $200 million would be about 8% of the median market estimate.
| Date | Company | Group | Round | Amount | Lead investor(s) | Note |
|---|---|---|---|---|---|---|
| 2022-01-11 | Pentera | Automated or AI pen testing | Series C | $150M | K1 Investment Management | — |
| 2022-01-27 | HackerOne | People-led or crowdsourced testing | Series E | $49M | GP Bullhound | — |
| 2022-10-05 | NetSPI | People-led or crowdsourced testing | Growth investment | $410M | KKR | Includes recapitalizing earlier investor Sunstone Partners; announced financing, not all new cash for operations |
| 2022-11-15 | Bishop Fox | People-led or crowdsourced testing | Series B incl. extension | $129M | Carrick Capital Partners; WestCap | Issuer-stated combined Series B total; includes $75M announced earlier and an extension, not $129M newly raised that day |
| 2023-08-08 | Horizon3.ai | Automated or AI pen testing | Series C | $40M | Craft Ventures | — |
| 2024-02-12 | Bugcrowd | People-led or crowdsourced testing | Growth financing | $102M | General Catalyst | Company release |
| 2025-03-12 | Pentera | Automated or AI pen testing | Series D | $60M | Evolution Equity Partners | Company release |
| 2025-06-10 | Horizon3.ai | Automated or AI pen testing | Series D | $100M | NEA | — |
| 2025-06-24 | XBOW | Automated or AI pen testing | Series B | $75M | Altimeter | Deal law firm |
| 2025-11-11 | Tenzai | Automated or AI pen testing | Seed | $75M | Greylock Partners; Battery Ventures; Lux Capital | — |
| 2026-01-14 | Novee | Automated or AI pen testing | Total funding to date (includes a Series A) | $51.5M | YL Ventures; Canaan Partners; Zeev Ventures | Total funding announced on launch, including a Series A; date printed in company release |
| 2026-03-10 | Armadin | AI red teaming | Seed and Series A, announced together | $189.9M | Accel | Company release; not counted in the pen testing total |
| 2026-03-18 | XBOW | Automated or AI pen testing | Series C | $120M | DFJ Growth; Northzone | — |
| 2026-08-03 | Horizon3.ai | Automated or AI pen testing | Series E | $250M | NightDragon; NEA | Company uses the Horizon3 brand; date printed in company release |
| 2026-10-01 | Armadin | AI red teaming | Series B | $255.5M | Andreessen Horowitz; Accel | Company release; not counted in the pen testing total; company rounds cumulative funding to $445M |
| 2026-10-06 | Hadrian | Automated or AI pen testing | Series B | $40M | Forgepoint Capital International; SmartFin | Company states $40M; no currency conversion used |
Source: original company releases and a deal law firm, linked, checked October 9, 2026. Funding is money raised, not revenue. Some announcements disclose several rounds or a combined round total; the notes identify them. The groups are editorial labels. The $771.5 million total covers the six companies listed here under automated or AI pen testing; Armadin is shown separately.
Since January 2025, six companies that sell automated or AI pen testing (Hadrian, Horizon3.ai, Novee, Pentera, Tenzai and XBOW) made eight announcements worth $771.5 million. This is the sum of the amounts disclosed in those announcements, including Novee's $51.5 million in total funding at launch. Hadrian's $40 million Series B sits right on the $40 million line; without it, the total is $731.5 million. Armadin, described as an AI red teaming company, disclosed $189.9 million in March and $255.5 million in October 2026. Those add to $445.4 million; Armadin rounds its reported total to $445 million. Its figures are outside the pen testing total. This list is a floor, not a full count. It holds only announcements of $40 million or more that we could confirm from an issuer or a transaction participant.
How big is penetration testing next to all security spending?
As a scale comparison, about 1.2%. In July 2025, Gartner forecast $213.025 billion of worldwide information security spending for 2025, including $83.812 billion on security services (Gartner, July 29, 2025). $2.52 billion is 1.2% of the first and about 3% of the second. These ratios compare different estimates; they are not measured shares of a common dataset.
That looks small next to Pentera's 11%, but the two measure different things. One sets a market model against all the world's security spending. The other is what very large companies told a vendor about their own budgets.
How big is the PTaaS market?
PTaaS means penetration testing as a service: pen testing sold through an online platform, often as an ongoing subscription. Estimates for 2026 from four research firms run from $0.72 billion (MarketsandMarkets) to $2.81 billion (The Business Research Company). The highest is 3.9 times the lowest. For 2025, five firms give a figure, from $0.57 billion to $3.24 billion.
| Publisher | Page date | 2024 | 2025 | 2026 | Forecast | Yearly growth | What it says it counts | Note |
|---|---|---|---|---|---|---|---|---|
| MarketsandMarkets | Apr 2026 | — | $0.57B | $0.72B | 2031: $1.98B | 22.6% | Platform and managed services | — |
| MarketsandMarkets (earlier edition) | Jul 15, 2024 | $0.12B | — | — | 2029: $0.30B | 20.5% | Not stated | Earlier edition; verified in MarketsandMarkets' own July 15, 2024 release. 2024 value: $118M; 2029 forecast: $301M. |
| Global Market Insights | Aug 2026 | — | $2.30B | $2.60B | 2035: $12.00B | 18.3% | Managed pen testing services ($1,283.4M) plus platform-based PTaaS ($983.7M) in 2025 | — |
| The Business Research Company | Sep 2026 | — | $2.31B | $2.81B | 2030: $6.05B | 21.2% | Services, tools and reporting | — |
| Persistence Market Research | Jun 2026 | — | — | $1.20B | 2033: $4.88B | 22.2% | Expert-led assessments combined with continuous testing platforms | — |
| Dataintelo | Oct 5, 2026 | — | $2.30B | — | 2034: $8.03B | 14.9% | Platform-delivered subscription and on-demand tests | — |
| WiseGuy Reports | Aug 2026 | $2.94B | $3.24B | — | 2035: $8.70B | 10.3% | Not stated | FAQ gives $3.24B for 2024; larger than the firm's own whole-market 2025 figure ($3.15B) |
| Credence Research | Dec 11 (no year shown) | $2.32B | — | — | 2032: $7.92B | 16.6% | Not stated | — |
| Polaris Market Research | Not shown | $0.13B | — | — | 2032: $0.59B | 20.4% | Not stated | Publisher press release; 2023 value $110.89M. CSV retains the exact 2024 and forecast values. |
| Strategic Market Research | Jul 2024 | — | — | — | 2030: $1.18B | 18.9% | Not stated | 2023 value $352M |
| Consegic Business Intelligence | Aug 2025 | $0.93B | — | — | 2032: Over $4.35847B | 18.2% | Not stated | Forecast is over $4,358.47M by 2032. Also says projected to grow by $1,144.80M in 2025; unclear whether that is the 2025 size, so no 2025 value is used. |
Source: linked publisher pages and the older issuer release, checked October 9, 2026. Values in US$ billions, rounded to two decimals here; the CSV retains full source precision and qualifiers. The QYResearch reseller page used in the draft now returns 404 and could not be traced to a matching original-publisher page. Its figures are excluded; the CSV retains the source and exclusion reason.
Three firms put 2025 at about $2.3 billion. A $2.30 billion PTaaS estimate is about 91% of the $2.52 billion median for the whole market. That ratio cannot establish PTaaS's share: it mixes publishers whose definitions differ. Firms that size both markets don't line up either. MarketsandMarkets' PTaaS figure for 2025 ($0.57 billion) is 29% of its own whole-market figure ($1.98 billion). Dataintelo's ($2.30 billion) is 93% of its own ($2.47 billion). WiseGuy Reports' ($3.24 billion) is bigger than its own whole-market figure ($3.15 billion).
So don't add a PTaaS figure to a whole-market total, and don't divide one firm's PTaaS figure by another firm's market size to make a "share." The categories overlap, and the labels are too loose to separate them. Both the lowest and highest 2026 estimates include platforms and services, so those short labels alone don't explain the gap.
Which rules require a penetration test?
Several rules and standards require penetration testing for the organizations they cover, including PCI DSS, New York's financial cybersecurity rule and the U.S. Coast Guard's maritime rule. The FTC's Safeguards Rule requires a yearly test when the test provision applies and qualifying ongoing monitoring is absent. HIPAA's current Security Rule does not name one. A yearly test was proposed in January 2025; July 2027 is the government's planned final-action date, not a deadline or a final rule.
| Rule | Where | What the text says | How often | Status |
|---|---|---|---|---|
| PCI DSS | PCI DSS v4.0.1, Requirements 11.4.2-11.4.6 | Requires internal and external penetration tests; segmentation tests apply when segmentation is used | Internal/external: at least every 12 months and after significant changes. Segmentation: at least every 12 months (six months for service providers) and after any segmentation changes | v4.0.1 current (Jun 2024) |
| New York DFS Cybersecurity Regulation | 23 NYCRR 500.5(a)(1); exemptions in 500.19 | Requires a penetration test for covered entities that are not exempt | At least annually, from inside and outside the system boundary | Second amendment effective Nov 1, 2023 |
| FTC Safeguards Rule (GLBA) | 16 CFR 314.4(d)(2); exemption in 314.6 | Requires annual penetration testing unless qualifying ongoing monitoring is used; the test provision exempts firms holding customer information on fewer than 5,000 consumers | Annual; vulnerability assessments at least every six months and after specified material changes | Effective Jun 9, 2023 |
| FedRAMP (legacy Rev5 guidance) | Penetration Test Guidance v3.0 (Jun 30, 2022), section 7 | Requires a penetration test | At initial authorization, then at least every 12 months, unless the authorizing body approves an exception with documented reasons | Legacy guidance; 2026 Consolidated Rules are in transition |
| NIST SP 800-53 Rev. 5 | Control CA-8; SP 800-53B, Table 3-4 | CA-8 is in the High baseline, not the Low or Moderate baseline; controls may be tailored | Set by the organization | Release 5.2.0 (Aug 2025) |
| CMMC Level 3 | 32 CFR 170.14(c)(4), CA.L3-3.12.1e | The Level 3 control text requires a penetration test; higher-level rollout is suspended | Control text: at least annually or after significant security changes | Rule effective Dec 16, 2024; Phase II and later rollout suspended Jul 13, 2026 |
| CMMC Level 2 | 32 CFR 170.14(c)(3); NIST SP 800-171 Rev. 2 | Does not name penetration testing | Not applicable | Rule effective Dec 16, 2024 |
| EU DORA (threat-led testing) | Regulation (EU) 2022/2554, Article 26(1) | Requires threat-led penetration testing for financial firms picked by regulators | Normally at least every 3 years; the regulator may increase or reduce the frequency | Applies from Jan 17, 2025 |
| EU DORA (general testing) | Regulation (EU) 2022/2554, Articles 24(6) and 25 | Requires yearly testing of systems supporting critical or important functions at financial firms other than microenterprises; penetration testing is one listed option | At least yearly; not a blanket yearly penetration-test requirement | Applies from Jan 17, 2025 |
| U.S. Coast Guard maritime cybersecurity rule | 33 CFR 101.650(e)(2); 101.630(e)(3) | Requires a penetration test | With each Cybersecurity Plan renewal (plans valid 5 years) | Effective Jul 16, 2025 |
| SEC Regulation SCI | 17 CFR 242.1003(b)(1)(i) | Requires penetration test reviews | Not less than once every three years | In force |
| HIPAA Security Rule (current) | 45 CFR 164.302-164.318 | Does not name penetration testing; 164.308(a)(8) asks for periodic evaluation | Periodic | In force |
| HIPAA Security Rule (proposed) | 90 FR 898, proposed 45 CFR 164.312(h)(2)(iii)(B) | Proposed, not final | Would be at least once every 12 months, or more often if the risk analysis calls for it | Proposed Jan 6, 2025; 2026 Unified Agenda lists Jul 2027 as a planning date, not a legal deadline |
| EU NIS2 Directive | Directive (EU) 2022/2555, Article 21 | Article 21 has no explicit penetration-test mandate or fixed schedule | No fixed penetration-test frequency in Article 21 | National measures were to apply from Oct 18, 2024; implementation depends on the country |
| Singapore MAS Technology Risk Management Guidelines | Paragraph 13.2.4 | Expects a penetration test (guidance, not law) | At least yearly for internet-facing systems, or after major changes | Guidelines dated Jan 18, 2021 |
Source: each rule's primary text, linked, checked October 9, 2026. The PCI source is the issuer's document library; the full issuer-authored v4.0.1 standard was also read in a university-hosted copy. NIST baseline placement comes from SP 800-53B, Table 3-4. The 15 entries include separate parts of DORA, CMMC and HIPAA; they are not 15 distinct laws.
CMMC's Level 3 control still says to test annually or after significant security changes. Its rollout status changed: the July 13, 2026 department statement suspended Phase II and later milestones, while Phase I self-assessments remain. A September 3 contracting deviation implements that direction.
FedRAMP is also in transition. Its 2026 timeline allows early adoption from July 4, 2026 and makes the consolidated rules generally mandatory from January 1, 2027, subject to specific dates within each area. The new Rev5 CA-8 control points to the vulnerability detection and response rules. The table labels the older annual-testing guidance so it is not mistaken for the whole current program.
The FTC exception covers effective continuous monitoring or other ongoing ways to detect changes that may create vulnerabilities; section 314.6 also exempts firms holding customer information on fewer than 5,000 consumers from this test provision. NIS2's recitals mention penetration testing, but Article 21 does not set a fixed penetration-test schedule. HIPAA's annual-testing text is still a proposal.
Not all of these are laws. PCI DSS is a card-industry standard that applies by contract. FedRAMP is a U.S. government cloud program. NIST SP 800-53 is a catalog of controls that agencies adopt. This is general information, not legal advice; read the rule itself or ask your auditor.
If you landed here because you need to buy a test, not size the market, Find My PenTest Match is our free scope checklist. It walks through what needs testing and what to ask providers, and it doesn't submit or save your picks.
How we built this
On October 9, 2026, we rechecked the 78 whole-market report entries supplied with this page. Of those, 75 pages could be read and three could not be retrieved. We checked original publisher pages, followed redirects and looked for original sources behind reseller listings. From each readable page we wrote down the dollar values and the years they're for, the growth rate, the date on the page, what the page says it counts, and anything on the page that contradicts itself. Research tools read the live text; rendered source images were also inspected where needed. These were automated checks, not a claimed human review. We didn't buy any report.
The rules we followed, so nobody can say we picked favorites:
- Which firms. The 78 listed entries are the starting sample. This audit checks that list; it does not claim a census of every research publisher. Reports on only part of the market (services only, PTaaS, one region, one kind of test) are kept out of whole-market totals.
- Which page. The publisher's own report page. Three exceptions remain flagged: Verified Market Research's second report (its main report gives no 2025 figure), Spherical Insights' own blog article, and Global Growth Insights' differently named “Cyber Security Penetration Testing Market.” Reseller figures without a readable original-publisher value are excluded.
- Which number. The opening market-size sentence comes first. If it has no 2025 value, use an explicit, year-labelled summary card, table or FAQ: P&S Intelligence's table, Verified Market Reports' summary card and FAQ, and Market Growth Reports' FAQ. If a later table shifts an opening 2025 value to another year, keep the opening value and flag the conflict. A later table that only relabels a non-2025 opening value as 2025 does not qualify; Global Insight Services is excluded on that basis. The where_2025_figure_sits column records the location. For 2026, use an explicit accepted year-labelled figure; Market Intelo's chart data and TrendX's rounded snapshot are labelled exceptions. Never fill a missing year with a CAGR calculation in the tracker.
- Flag readable conflicts. A page gets † if another part gives a different 2025 value or ties it to another year, or if it is one of the three page-scope exceptions above. Seven of the 38 accepted 2025 pages carry a flag. A flag is not our claim that the number is false; it means we would not cite that page on its own. Other forecast, regional and date conflicts stay visible in the notes.
- Exclude unusable numbers. Six entries are set aside: 6Wresearch (unresolved printed units), Global Insight Services (no clear base year), Verified Market Reports' second page (no currency and conflicting years), Cognitive (numbers labelled illustrative), 360iResearch and Market Glass (no original-publisher figure verified). Data Insights Market, Adroit and KBV could not be retrieved. Their earlier draft numbers are not current verified data. Every excluded entry remains listed with its reason.
- Keep qualifiers and definitions. “Over” and “exceed” are lower bounds, so those forecasts stay out of point-forecast medians. Research Nester's growth-rate floor is above the middle of the rate list and therefore cannot move its median; it is not counted inside the 13%–17% band. “About,” “approximately” and “nearly” are retained with estimated point values. Every accepted page gets equal weight. Nothing else is dropped for being high or low.
To repeat the headline, filter the CSV to used_for_2025_median = yes, sort the 38 usd_bn_2025 values, and average the 19th and 20th: ($2.50B + $2.54B) ÷ 2 = $2.52B. Use the source precision in the CSV, not rounded display labels. All money is in U.S. dollars unless marked otherwise; millions are divided by 1,000 to give billions. Blanks are not zero.
The data pack includes a script for medians, inclusive ranges, growth rates, forecast groups, sensitivities, share comparisons, funding totals and chart values. Industry, test-type and region classifications have their own CSV with years, source links and locators; missing or conflicting leaders are outside clear-leader counts. The older-edition table alone uses calculated year alignments, each labelled with its formula. How The PenTest Index works explains how we date and check sources across the site, and how we make money explains how the site is funded.
What this data does and doesn't show
It shows what research publishers say on their free pages on one day. It doesn't show measured sales. We found no government agency or industry body that counts global pen testing revenue.
- These are estimates, not sales records. The median is the middle of 38 published views, not a measurement.
- Twenty of the 38 pages don't say whether they count software, so they may not be measuring the same thing.
- Some brands share an owner. Similar shares alone do not prove common models. The median stays between $2.36 billion and $2.64 billion in the 11 alternative checks shown above.
- Seven of the 38 pages are flagged, and they're in the median. Without them it's $2.50 billion. The two middle pages in the full set are unflagged.
- Picking one figure from a page that contradicts itself is a judgment. The “Check before citing” notes show each recorded conflict.
- This is an audit of the supplied list, not a complete list of every page that exists. Three listed pages could not be read; two entries could be read only at resellers and have no accepted original-publisher figure.
- The UK survey covers the UK only. One company's revenue isn't the market. The funding list holds only announcements of $40 million or more that we could confirm, and includes disclosed cumulative amounts where labelled.
- Pages change. Every row shows the date we checked.
How to cite this page
Credit the original publisher when you quote its number. Credit The PenTest Index when you use the median, ranges, counts, flags or charts.
Reference: The PenTest Index. "Penetration Testing Market Size: About $2.52 Billion in 2025, Across 38 Estimates." Updated October 9, 2026. https://thepentestindex.com/research/penetration-testing-market/
In a sentence: "The median of 38 published estimates puts the global penetration testing market at about $2.52 billion in 2025, according to The PenTest Index (October 9, 2026)."
Reusing our work: You're welcome to reuse The PenTest Index's own figures on this page (the medians, ranges, counts and flags) and its charts, with credit to The PenTest Index. Each estimate in the tracker comes from the publisher named beside it, so credit that publisher and follow its terms when you use its material.
Download the data
Download penetration-testing-market-estimates.csv: all 78 report entries checked, one row each, with the 2025 and 2026 values, forecast, growth rate, page date, flag, the note, the source link and the date checked. Free, no form, no email.
Download the full data pack (.zip): the file above plus older editions, PTaaS estimates, funding announcements, rules, shared-pattern shares, supporting figures, the source-by-source classifications, calculation and chart scripts, and a README that explains every column.
- penetration-testing-market-estimates.csv
- penetration-testing-market-older-editions.csv
- ptaas-market-estimates.csv
- penetration-testing-funding-rounds.csv
- penetration-testing-rules.csv
- penetration-testing-related-shares.csv
- penetration-testing-supporting-data.csv
- penetration-testing-market-classifications.csv
Frequently asked questions
How big is the penetration testing market?
Published estimates put the global penetration testing market at about $2.52 billion in 2025. That's the median of 38 estimates from research firms, and 25 of them fall between $2.0 billion and $3.0 billion. The full range is $1.80 billion to $11.59 billion. For 2026, the median of 17 estimates is $2.91 billion. Figures and sources.
How fast is the penetration testing market growing?
About 14.5% a year, by the median forecast rate across 38 report pages. 27 stated rates fall between 13% and 17%; one other rate is stated only as “over 16.4%.” These are forecasts, not measured growth. Calculation and limits.
How big will the penetration testing market be by 2034?
Twelve published forecasts end in 2034, with a median of about $8.7 billion. Eleven of the twelve fall between $6.99 billion and $10.46 billion. Forecasts by year.
Why are penetration testing market size estimates so different?
The free report pages don't say enough to explain it. Twenty of the 38 don't say whether they count software as well as testing services, and that group holds the widest gaps. Some firms also print different numbers on the same page. Scope and conflicts.
Which penetration testing market estimate should I cite?
Name the firm, the year the number is for, and the date on its page. Or cite the median of the 38 accepted estimates with The PenTest Index as the source. Don't join a starting value from one edition of a report to an end value from another. Ready-to-copy citation.
How big is the U.S. penetration testing market?
Two accepted publisher estimates put the 2025 U.S. market between $600 million and $800.85 million: Dimension Market Research and Precedence Research. That's 28.5% to 30% of their own world totals. Dimension's figure was a projection from its August 2025 edition. U.S. source table.
How big is the penetration testing as a service (PTaaS) market?
Four research firms put the 2026 PTaaS market between $0.72 billion and $2.81 billion. The highest is 3.9 times the lowest, and the pages don't explain why. Keep PTaaS figures separate from whole-market totals. Publisher estimates.
Is penetration testing in demand as a job?
U.S. government data doesn't count penetration testers on their own. The broader group, information security analysts, held 192,900 jobs in 2025 with median pay of $129,180 in May 2025. The Bureau of Labor Statistics projects 21% growth from 2025 to 2035 (BLS). A market forecast measures spending, not jobs.
Is a penetration test required by law?
Sometimes, by law or by contract. PCI DSS and New York's financial cybersecurity rule require penetration testing for the organizations they cover. HIPAA's current Security Rule does not name one; annual testing remains proposed. Requirements, exemptions and rollout dates differ. The rule table shows the text and status. This is general information, not legal advice.
Who are the biggest penetration testing companies?
We found no ranking by audited pen testing-only sales. NCC Group's business line that includes pen testing took in £88.4 million in the year to September 2025, and NetSPI and Synack say their merged company “is well over $200 million in revenue,” with no period given. These mixed-service figures cannot establish a pen testing revenue ranking. Company sources. To compare providers on published prices and terms, see our comparison of penetration testing companies.
Sources
Sources and retrieval results checked October 9, 2026. Unavailable and excluded entries are identified in the tables; listing a source here does not make its figures accepted.
- Verified Market Research (Pen-testing Market report) — report entry
- 360iResearch (via GII reseller listing) — report entry (unavailable or excluded; see reason)
- Cognitive Market Research — report entry (unavailable or excluded; see reason)
- Vyansa Intelligence — report entry
- MarketsandMarkets — report entry
- Dimension Market Research — report entry
- Data Insights Market — report entry (unavailable or excluded; see reason)
- DataM Intelligence — report entry
- Research Nester — report entry
- P&S Intelligence — report entry
- Reports Insights — report entry
- SkyQuest — report entry
- Future Market Insights — report entry
- Growth Market Reports — report entry
- Market Glass, Inc. (Global Industry Analysts) via Research and Markets — report entry (unavailable or excluded; see reason)
- IndustryARC — report entry
- Mordor Intelligence — report entry
- Market Data Forecast — report entry
- Straits Research — report entry
- Polaris Market Research — report entry
- Dataintelo — report entry
- Emergen Research — report entry
- Verified Market Reports — report entry
- Market Research Future — report entry
- The Insight Partners — report entry
- Fortune Business Insights — report entry
- Market Intelo — report entry
- Precedence Research — report entry
- TrendX Insights — report entry
- Value Market Research — report entry
- Reportprime — report entry
- Maximize Market Research — report entry
- WiseGuy Reports — report entry
- Data Bridge Market Research — report entry
- BrandEssence Market Research — report entry
- Market Growth Reports — report entry
- Vantage Market Research — report entry
- Spherical Insights (blog article) — report entry
- Global Growth Insights — report entry
- Market Research Intellect — report entry
- TechSci Research — report entry
- Exactitude Consultancy — report entry
- Fundamental Business Insights — report entry (unavailable or excluded; see reason)
- MarkWide Research — report entry (unavailable or excluded; see reason)
- 6Wresearch — report entry (unavailable or excluded; see reason)
- Global Insight Services — report entry (unavailable or excluded; see reason)
- Verified Market Reports (Pen-testing Market page) — report entry (unavailable or excluded; see reason)
- Adroit Market Research — report entry (unavailable or excluded; see reason)
- Allied Market Research — report entry (unavailable or excluded; see reason)
- Coherent Market Insights — report entry (unavailable or excluded; see reason)
- Consainsights — report entry (unavailable or excluded; see reason)
- Credence Research — report entry (unavailable or excluded; see reason)
- Cybersecurity Ventures — report entry (unavailable or excluded; see reason)
- Fatpos Global — report entry (unavailable or excluded; see reason)
- Global Market Estimates — report entry (unavailable or excluded; see reason)
- Global Market Insights — report entry (unavailable or excluded; see reason)
- GMI Research — report entry (unavailable or excluded; see reason)
- Grand View Research — report entry (unavailable or excluded; see reason)
- HTF Market Intelligence — report entry (unavailable or excluded; see reason)
- IMIR Market Research — report entry (unavailable or excluded; see reason)
- KBV Research — report entry (unavailable or excluded; see reason)
- Ken Research — report entry (unavailable or excluded; see reason)
- Kenneth Research — report entry (unavailable or excluded; see reason)
- Knowledge Sourcing Intelligence — report entry (unavailable or excluded; see reason)
- Lucintel — report entry (unavailable or excluded; see reason)
- Markets and Data — report entry (unavailable or excluded; see reason)
- Meticulous Research — report entry (unavailable or excluded; see reason)
- Orion Market Research (OMR Global) — report entry (unavailable or excluded; see reason)
- Report Ocean — report entry (unavailable or excluded; see reason)
- SNS Insider — report entry (unavailable or excluded; see reason)
- Strategic Market Research — report entry (unavailable or excluded; see reason)
- Stratistics MRC — report entry (unavailable or excluded; see reason)
- Technavio — report entry (unavailable or excluded; see reason)
- Transparency Market Research — report entry (unavailable or excluded; see reason)
- Up Market Research — report entry (unavailable or excluded; see reason)
- Verified Market Research (main report) — report entry (unavailable or excluded; see reason)
- Virtue Market Research — report entry (unavailable or excluded; see reason)
- Zion Market Research — report entry (unavailable or excluded; see reason)
- 360iResearch — original publisher summary, no market sizing
- MarketsandMarkets — U.S. page, excluded from U.S. range
- MarketsandMarkets — edition 2020-03-12
- MarketsandMarkets — edition 2021-08-10
- MarketsandMarkets — edition 2022-08-24
- MarketsandMarkets — edition 2024-04-03
- Verified Market Research — edition 2018-09-19
- Fortune Business Insights — edition 2023-09-18
- Future Market Insights — edition 2023-11-09
- SNS Insider — edition 2024-08-30
- MarketsandMarkets — PTaaS entry
- MarketsandMarkets (earlier edition) — PTaaS entry
- Global Market Insights — PTaaS entry
- The Business Research Company — PTaaS entry
- Persistence Market Research — PTaaS entry
- Dataintelo — PTaaS entry
- WiseGuy Reports — PTaaS entry
- Credence Research — PTaaS entry
- Polaris Market Research — PTaaS entry
- Strategic Market Research — PTaaS entry
- QYResearch (via Valuates Reports) — PTaaS entry
- Consegic Business Intelligence — PTaaS entry
- Pentera — funding announcement 2022-01-11
- HackerOne — funding announcement 2022-01-27
- NetSPI — funding announcement 2022-10-05
- Bishop Fox — funding announcement 2022-11-15
- Horizon3.ai — funding announcement 2023-08-08
- Bugcrowd — funding announcement 2024-02-12
- Pentera — funding announcement 2025-03-12
- Horizon3.ai — funding announcement 2025-06-10
- XBOW — funding announcement 2025-06-24
- Tenzai — funding announcement 2025-11-11
- Novee — funding announcement 2026-01-14
- Armadin — funding announcement 2026-03-10
- XBOW — funding announcement 2026-03-18
- Horizon3.ai — funding announcement 2026-08-03
- Armadin — funding announcement 2026-10-01
- Hadrian — funding announcement 2026-10-06
- PCI DSS — PCI DSS v4.0.1, Requirements 11.4.2-11.4.6
- PCI DSS — additional primary text
- New York DFS Cybersecurity Regulation — 23 NYCRR 500.5(a)(1); exemptions in 500.19
- FTC Safeguards Rule (GLBA) — 16 CFR 314.4(d)(2); exemption in 314.6
- FTC Safeguards Rule (GLBA) — additional primary text
- FTC Safeguards Rule (GLBA) — additional primary text
- FedRAMP (legacy Rev5 guidance) — Penetration Test Guidance v3.0 (Jun 30, 2022), section 7
- FedRAMP (legacy Rev5 guidance) — additional primary text
- FedRAMP (legacy Rev5 guidance) — additional primary text
- FedRAMP (legacy Rev5 guidance) — additional primary text
- NIST SP 800-53 Rev. 5 — Control CA-8; SP 800-53B, Table 3-4
- NIST SP 800-53 Rev. 5 — additional primary text
- NIST SP 800-53 Rev. 5 — additional primary text
- NIST SP 800-53 Rev. 5 — additional primary text
- CMMC Level 3 — 32 CFR 170.14(c)(4), CA.L3-3.12.1e
- CMMC Level 3 — additional primary text
- CMMC Level 3 — additional primary text
- CMMC Level 2 — additional primary text
- EU DORA (threat-led testing) — Regulation (EU) 2022/2554, Article 26(1)
- U.S. Coast Guard maritime cybersecurity rule — 33 CFR 101.650(e)(2); 101.630(e)(3)
- U.S. Coast Guard maritime cybersecurity rule — additional primary text
- SEC Regulation SCI — 17 CFR 242.1003(b)(1)(i)
- HIPAA Security Rule (current) — 45 CFR 164.302-164.318
- HIPAA Security Rule (proposed) — 90 FR 898, proposed 45 CFR 164.312(h)(2)(iii)(B)
- HIPAA Security Rule (proposed) — additional primary text
- EU NIS2 Directive — Directive (EU) 2022/2555, Article 21
- Singapore MAS Technology Risk Management Guidelines — Paragraph 13.2.4
- Singapore MAS Technology Risk Management Guidelines — additional primary text
- UK Cyber Security Breaches Survey 2025/2026 (DSIT, Home Office)
- UK CSBS 2025/2026 data tables
- UK Cyber Security Breaches Survey 2025
- NCC Group plc preliminary results
- NCC Group unaudited interim results (republished)
- NetSPI press release, Sep 2, 2026
- Gartner press release, Jul 29, 2025
- Pentera issuer press release, May 8, 2025
- BLS Occupational Outlook Handbook
- NCC Group plc August 2024 results
- NIST — penetration testing glossary
- NCC Group — Technical Assurance services
- London Stock Exchange — NCC Group listing
- Synack — merger completion notice
- Dataintelo — services-only report
The PenTest Index is independent research for penetration testing buyers. It does not perform, authorize or certify penetration testing.